


2
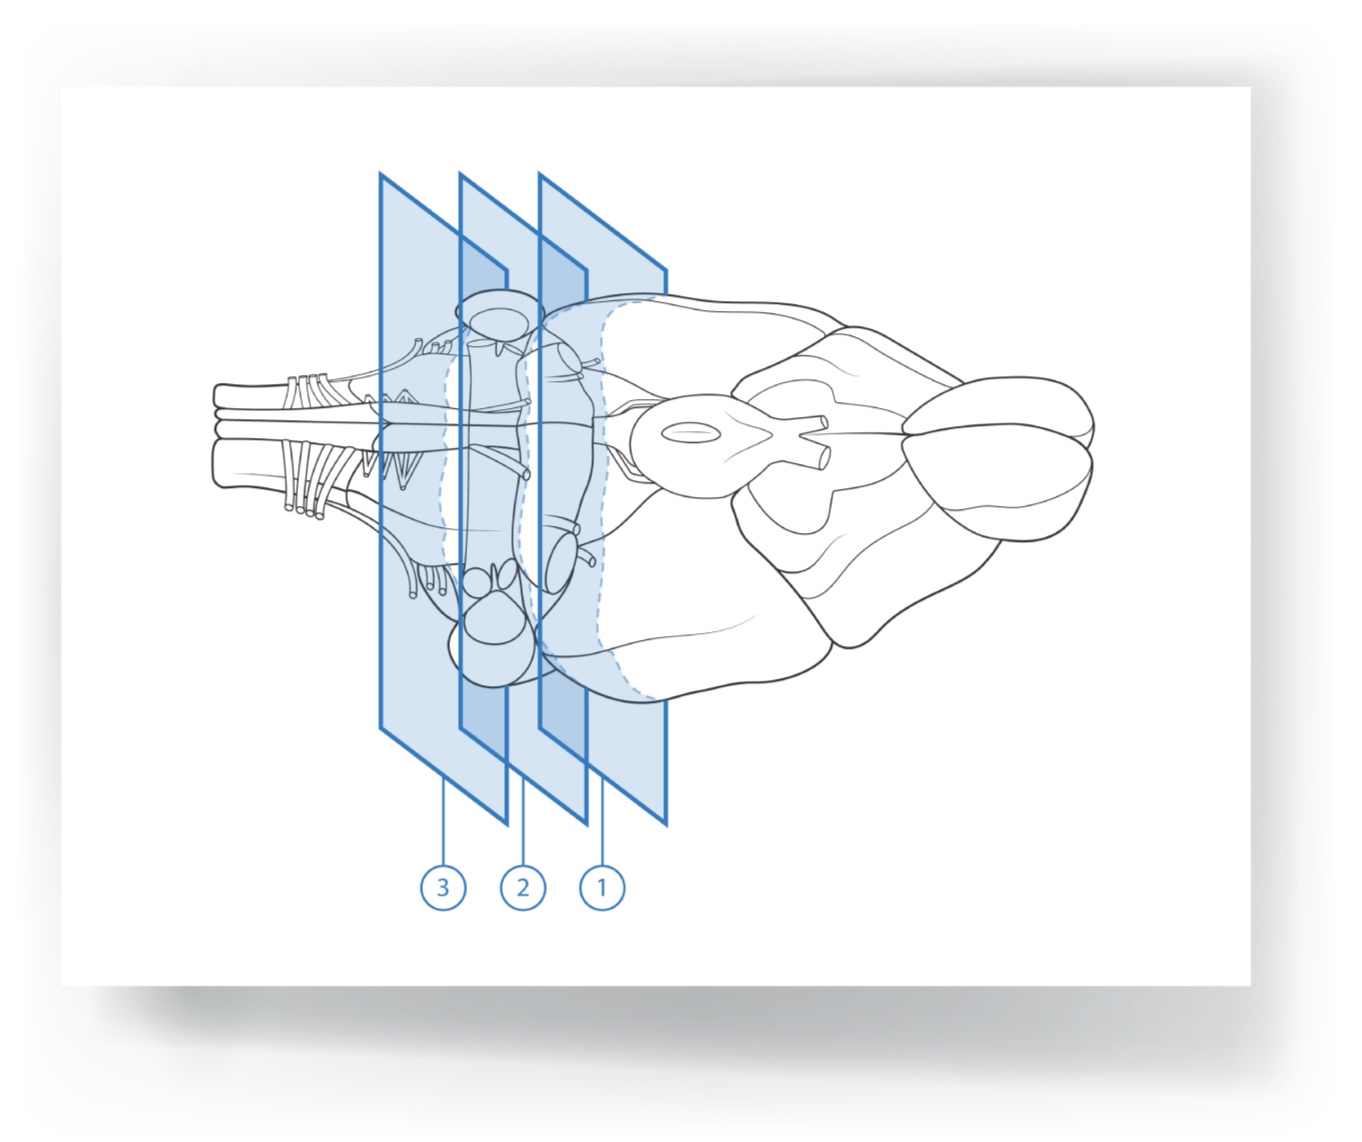
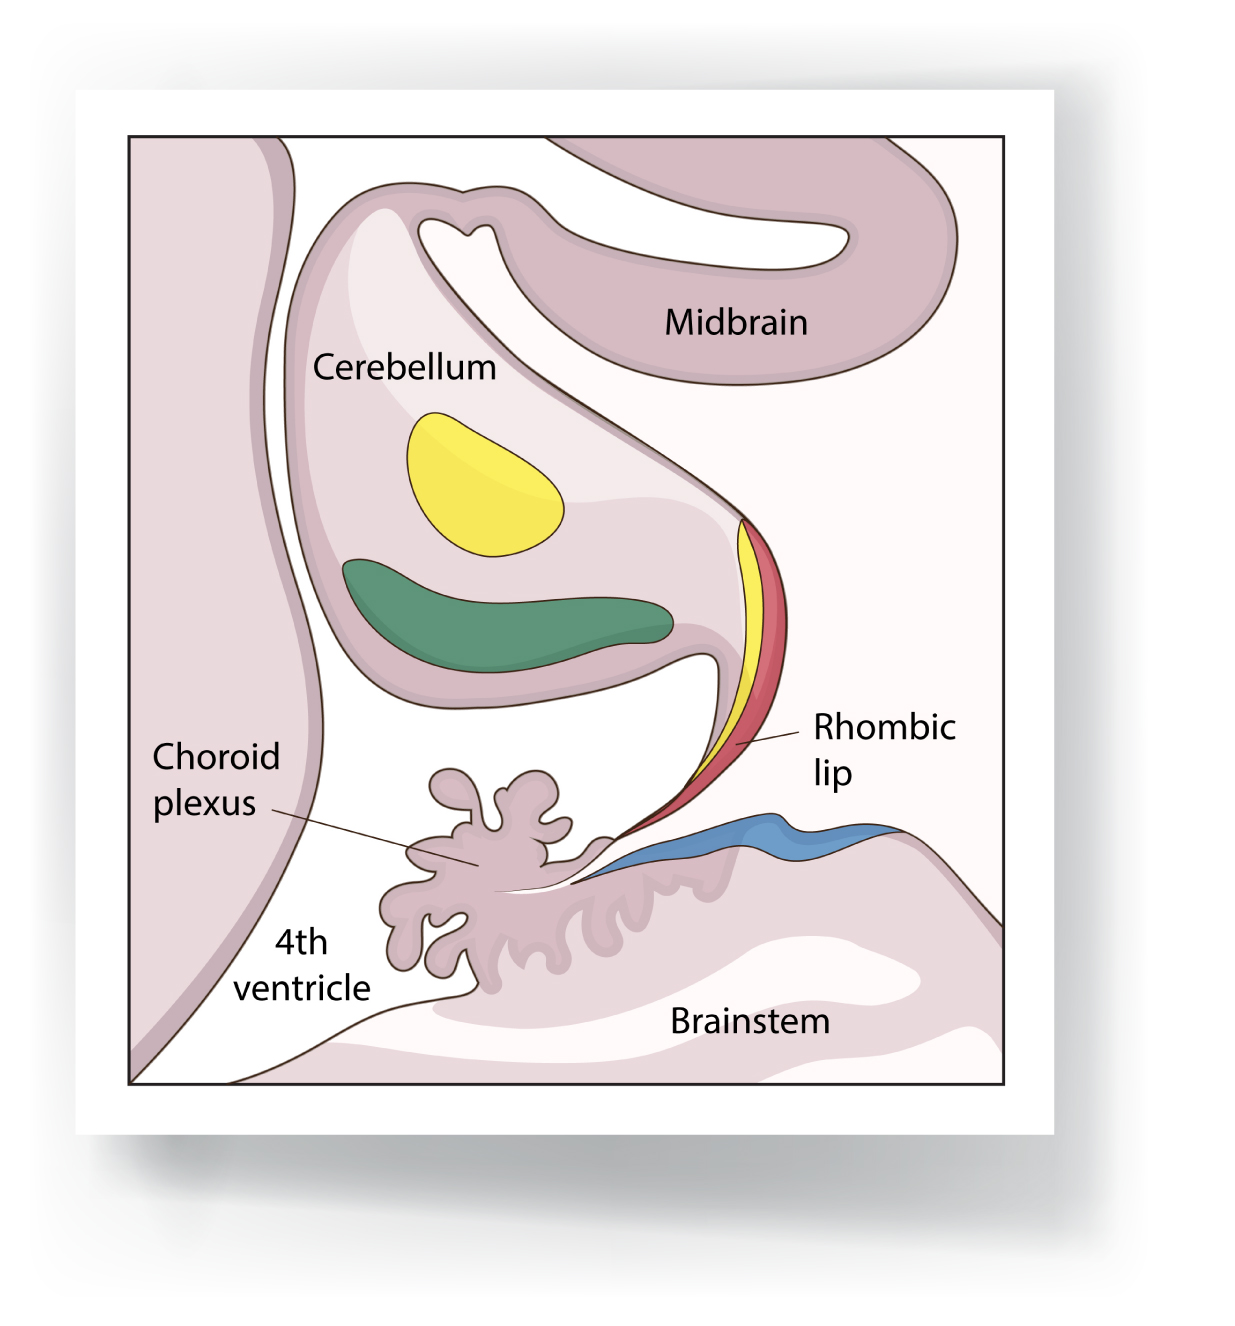
Rat Brain Anatomy

1
Jack Beqaj Poster
0
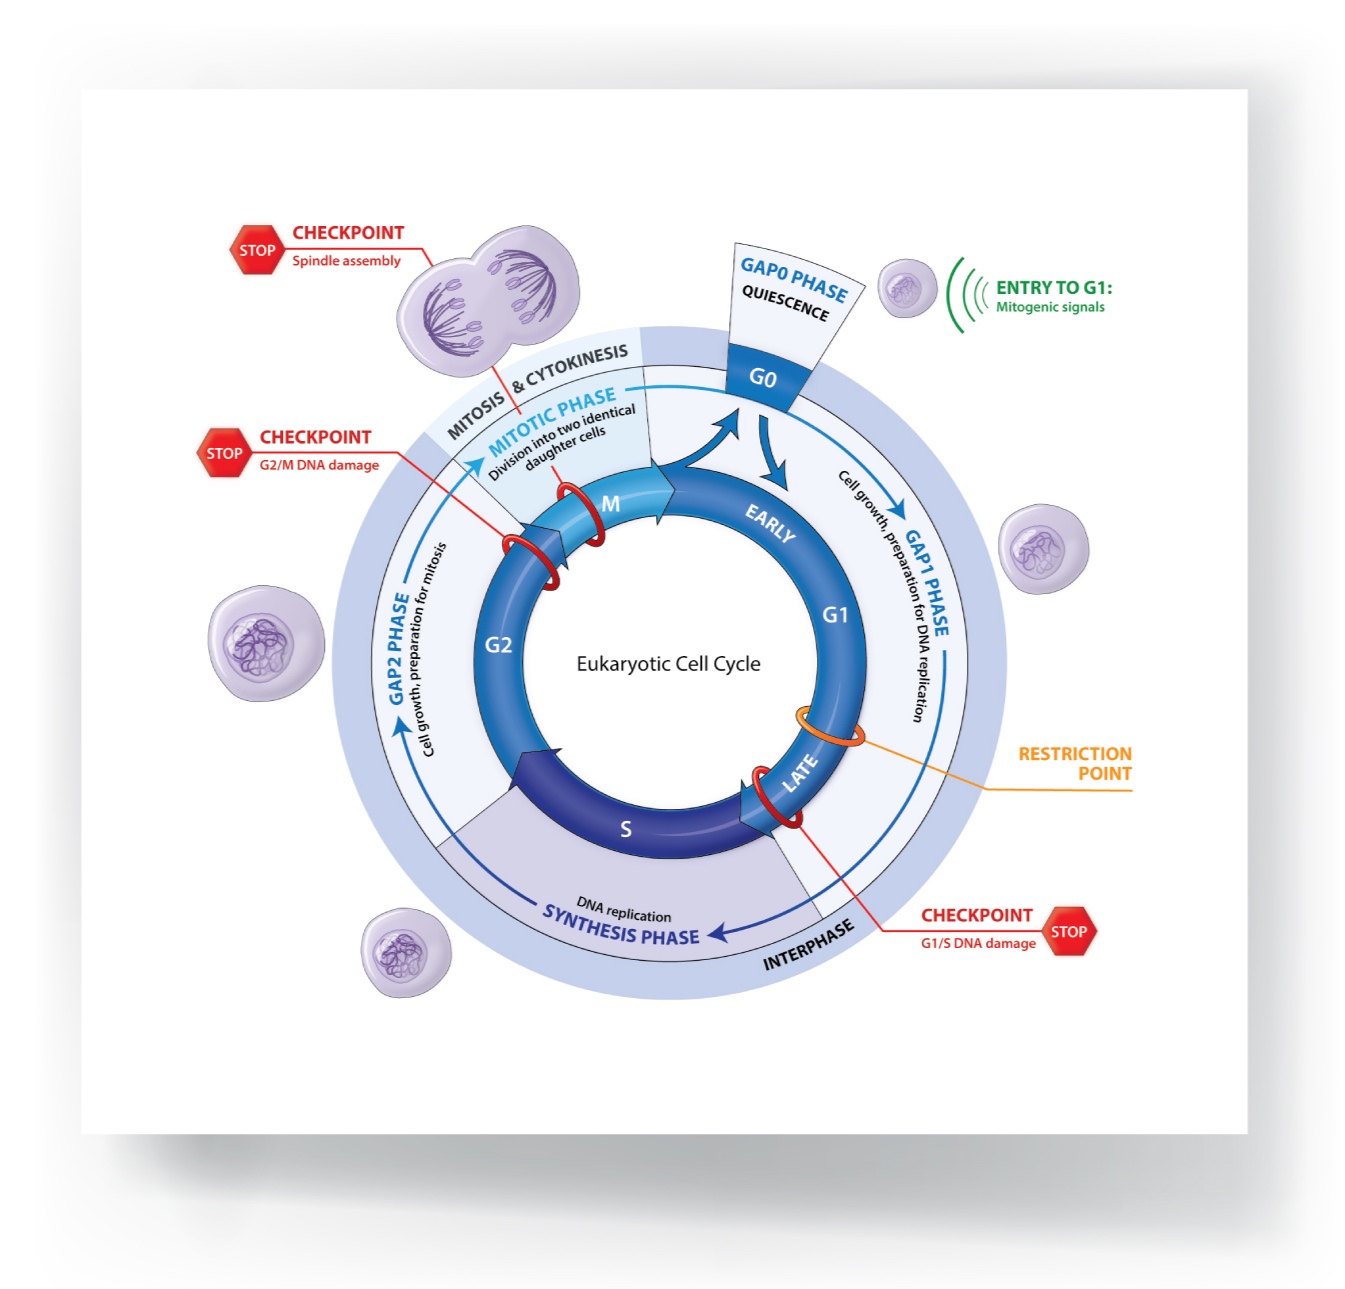
The Eukaryotic Cell Cycle
1
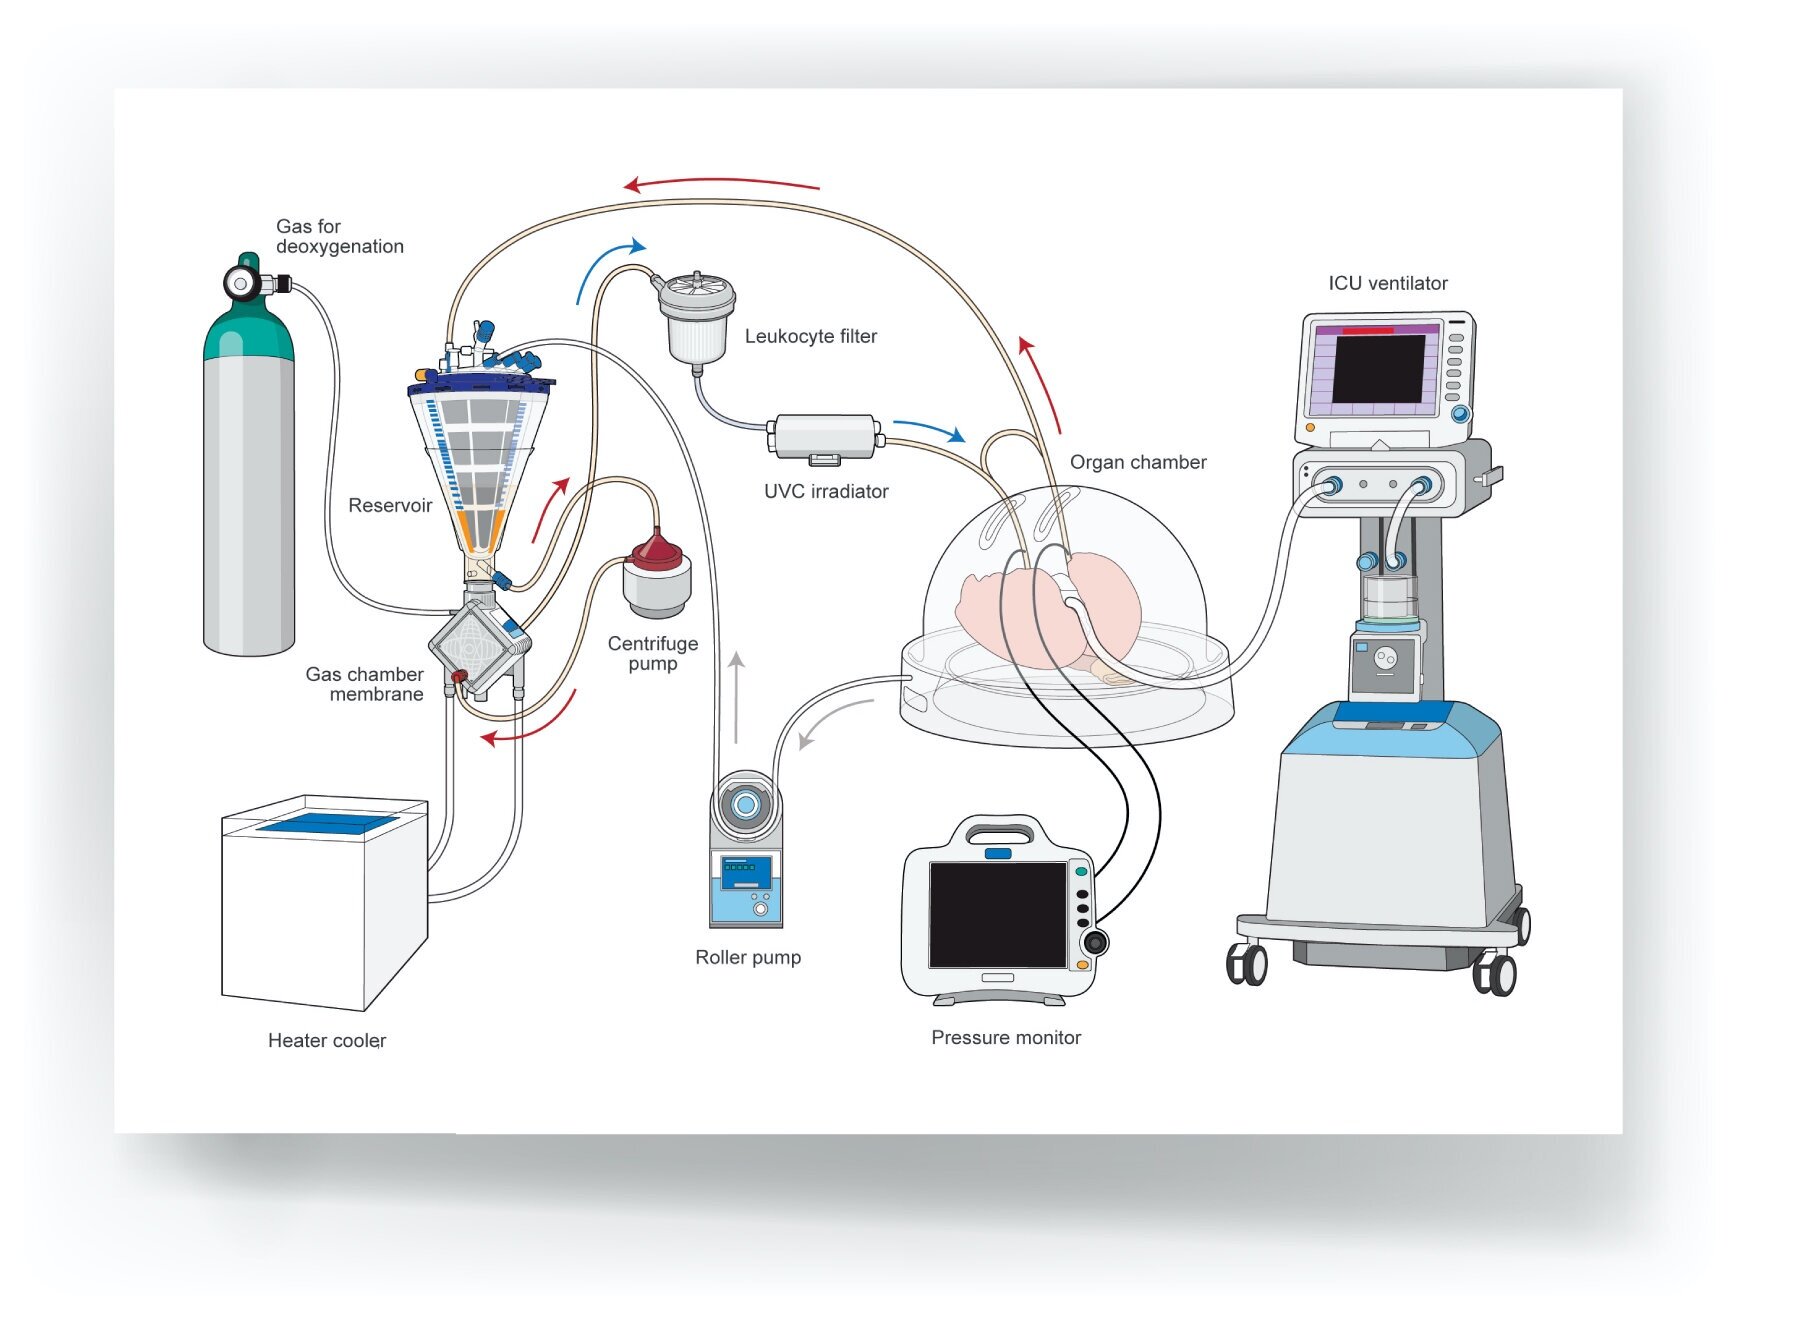
Ex vivo Lung Perfusion
12
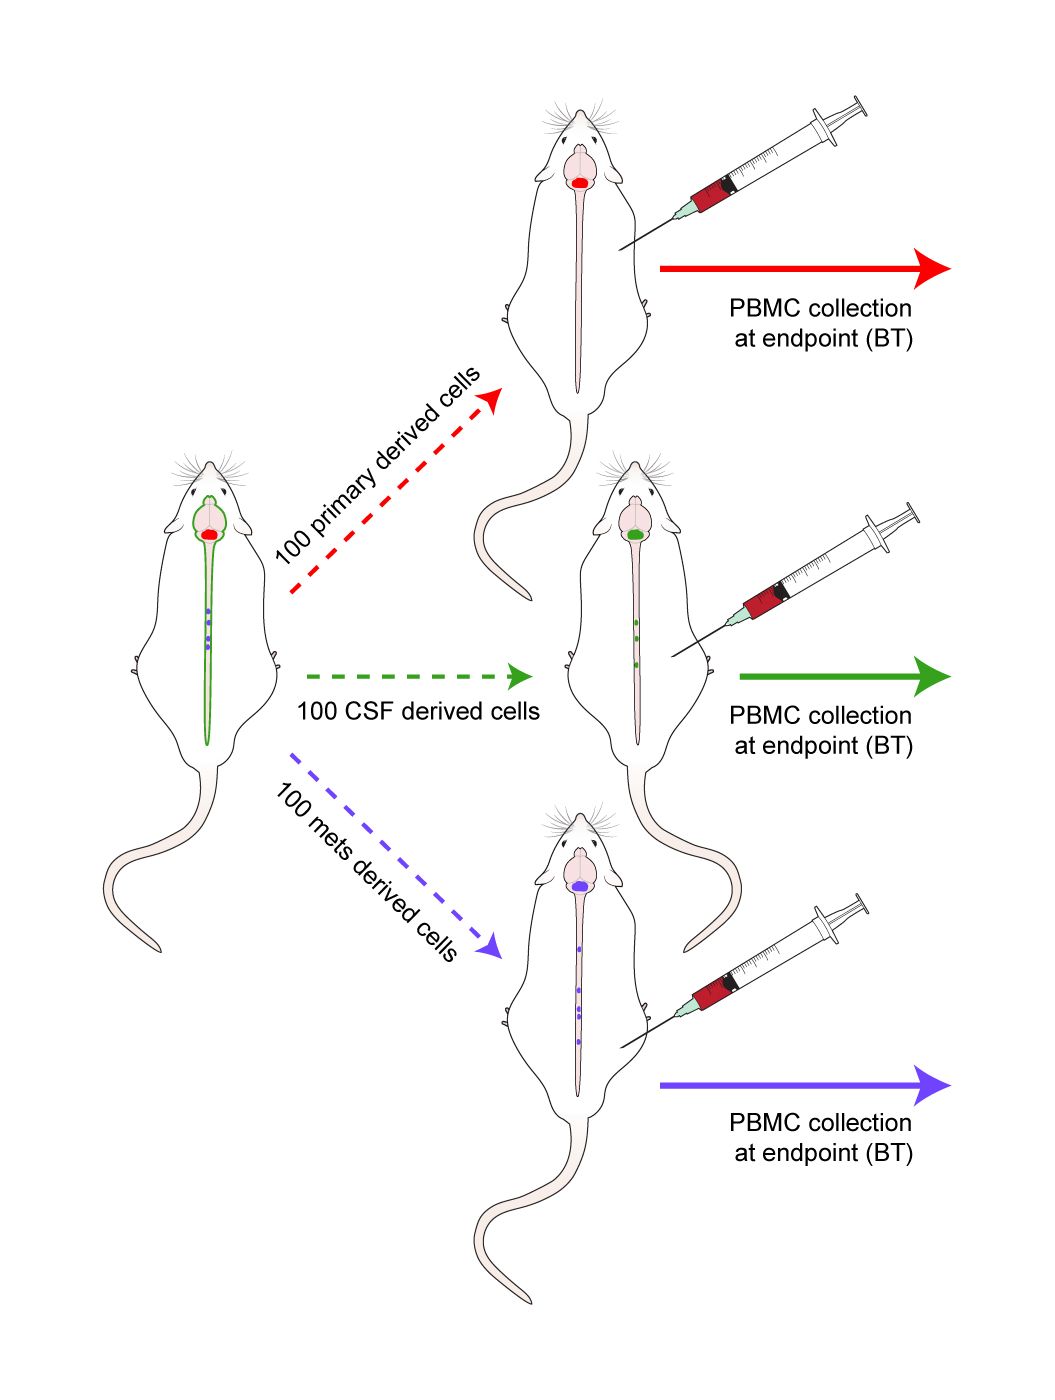
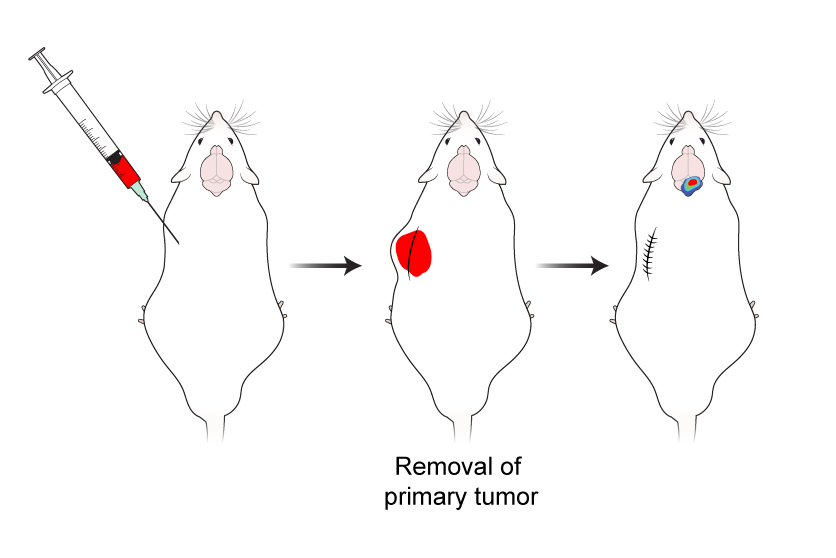
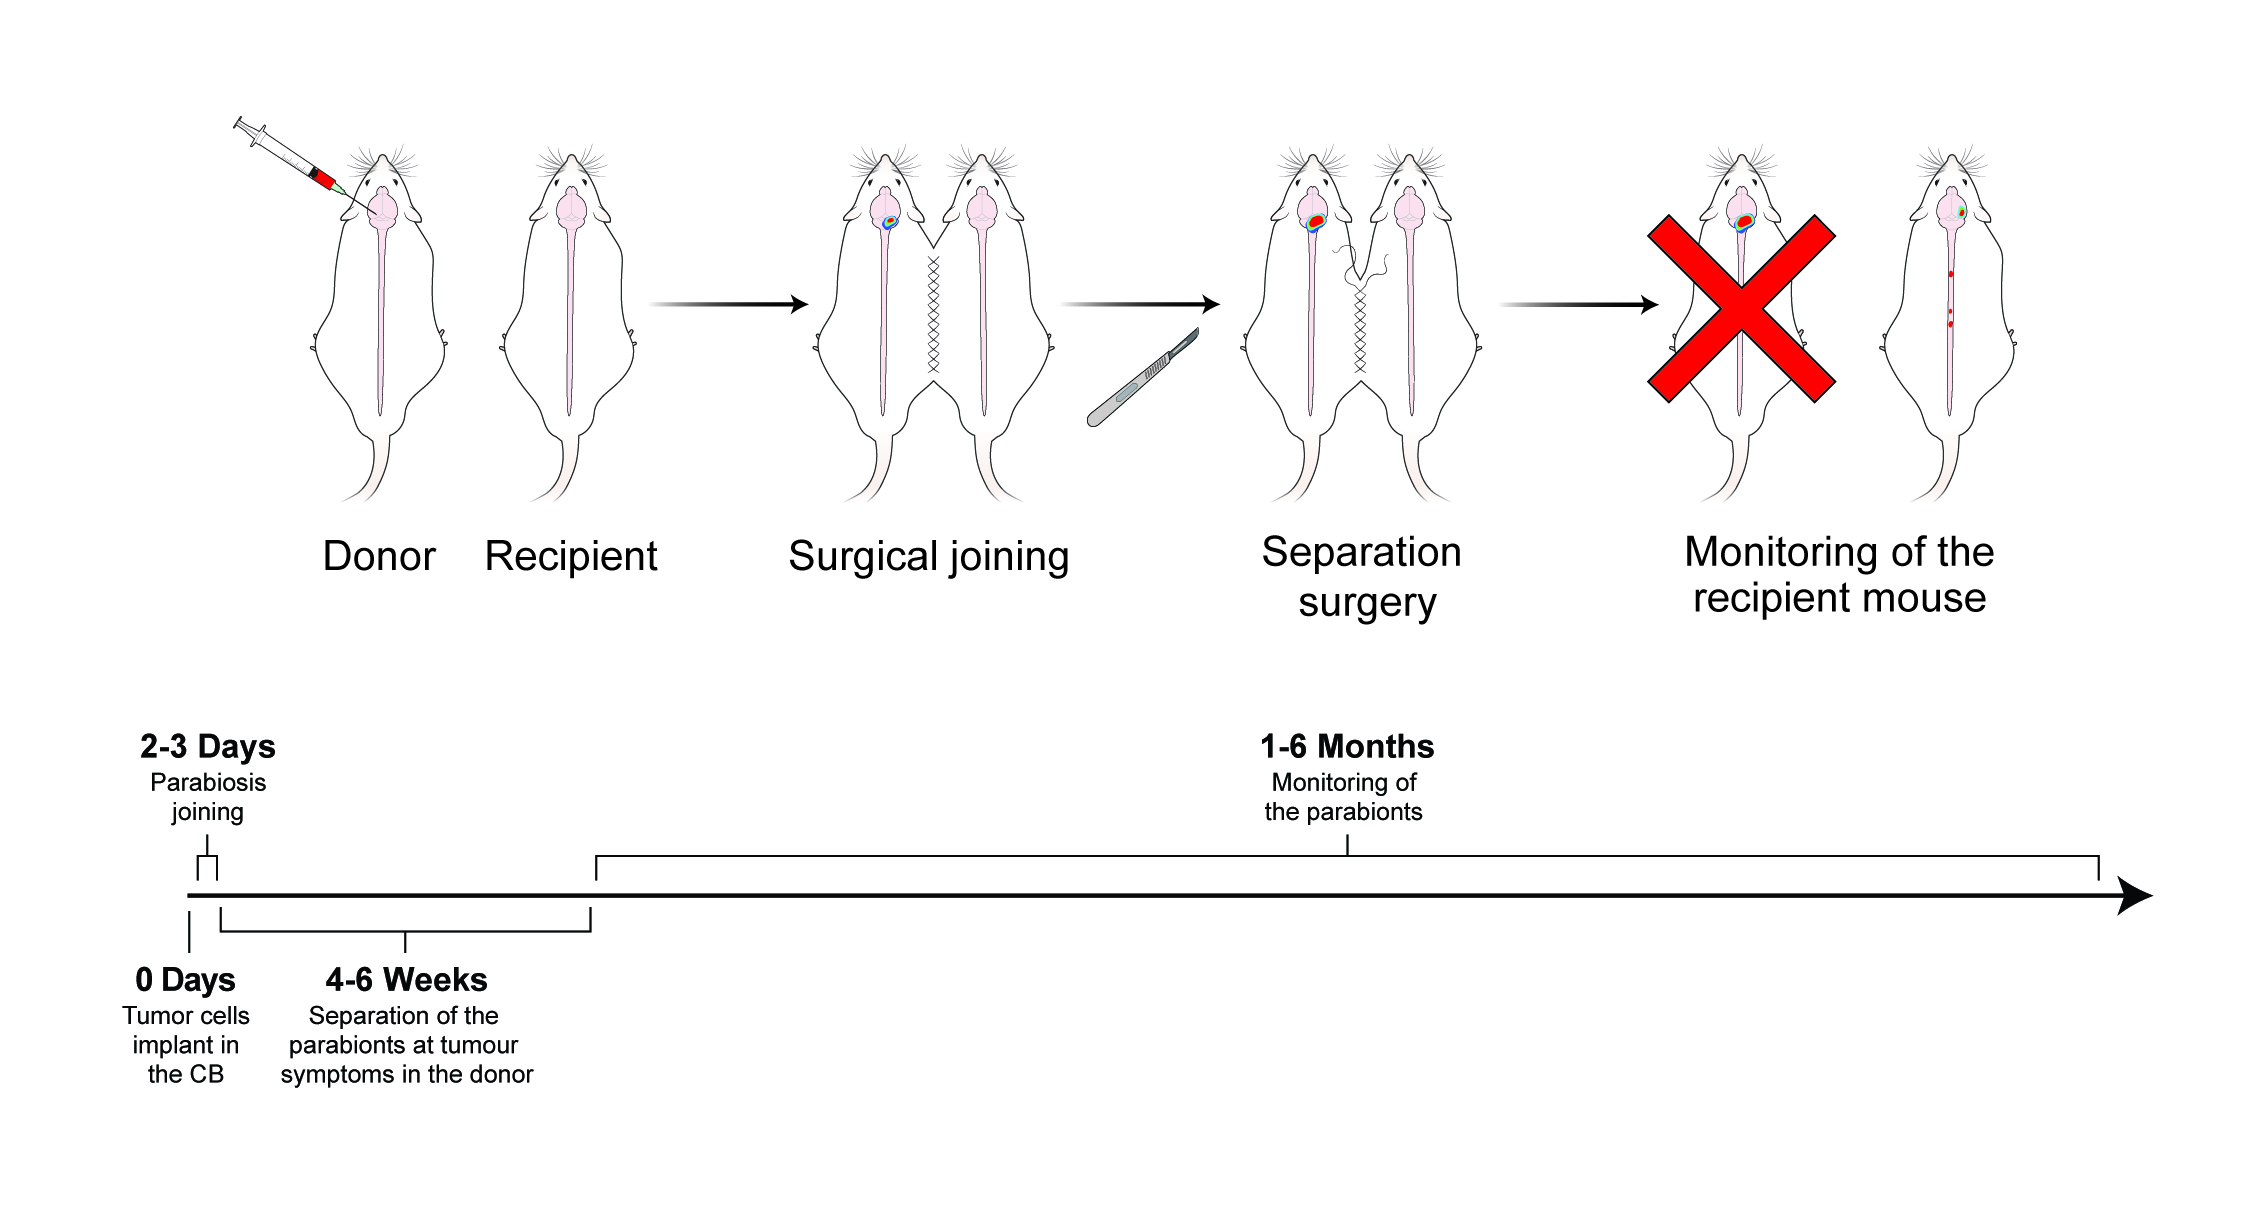
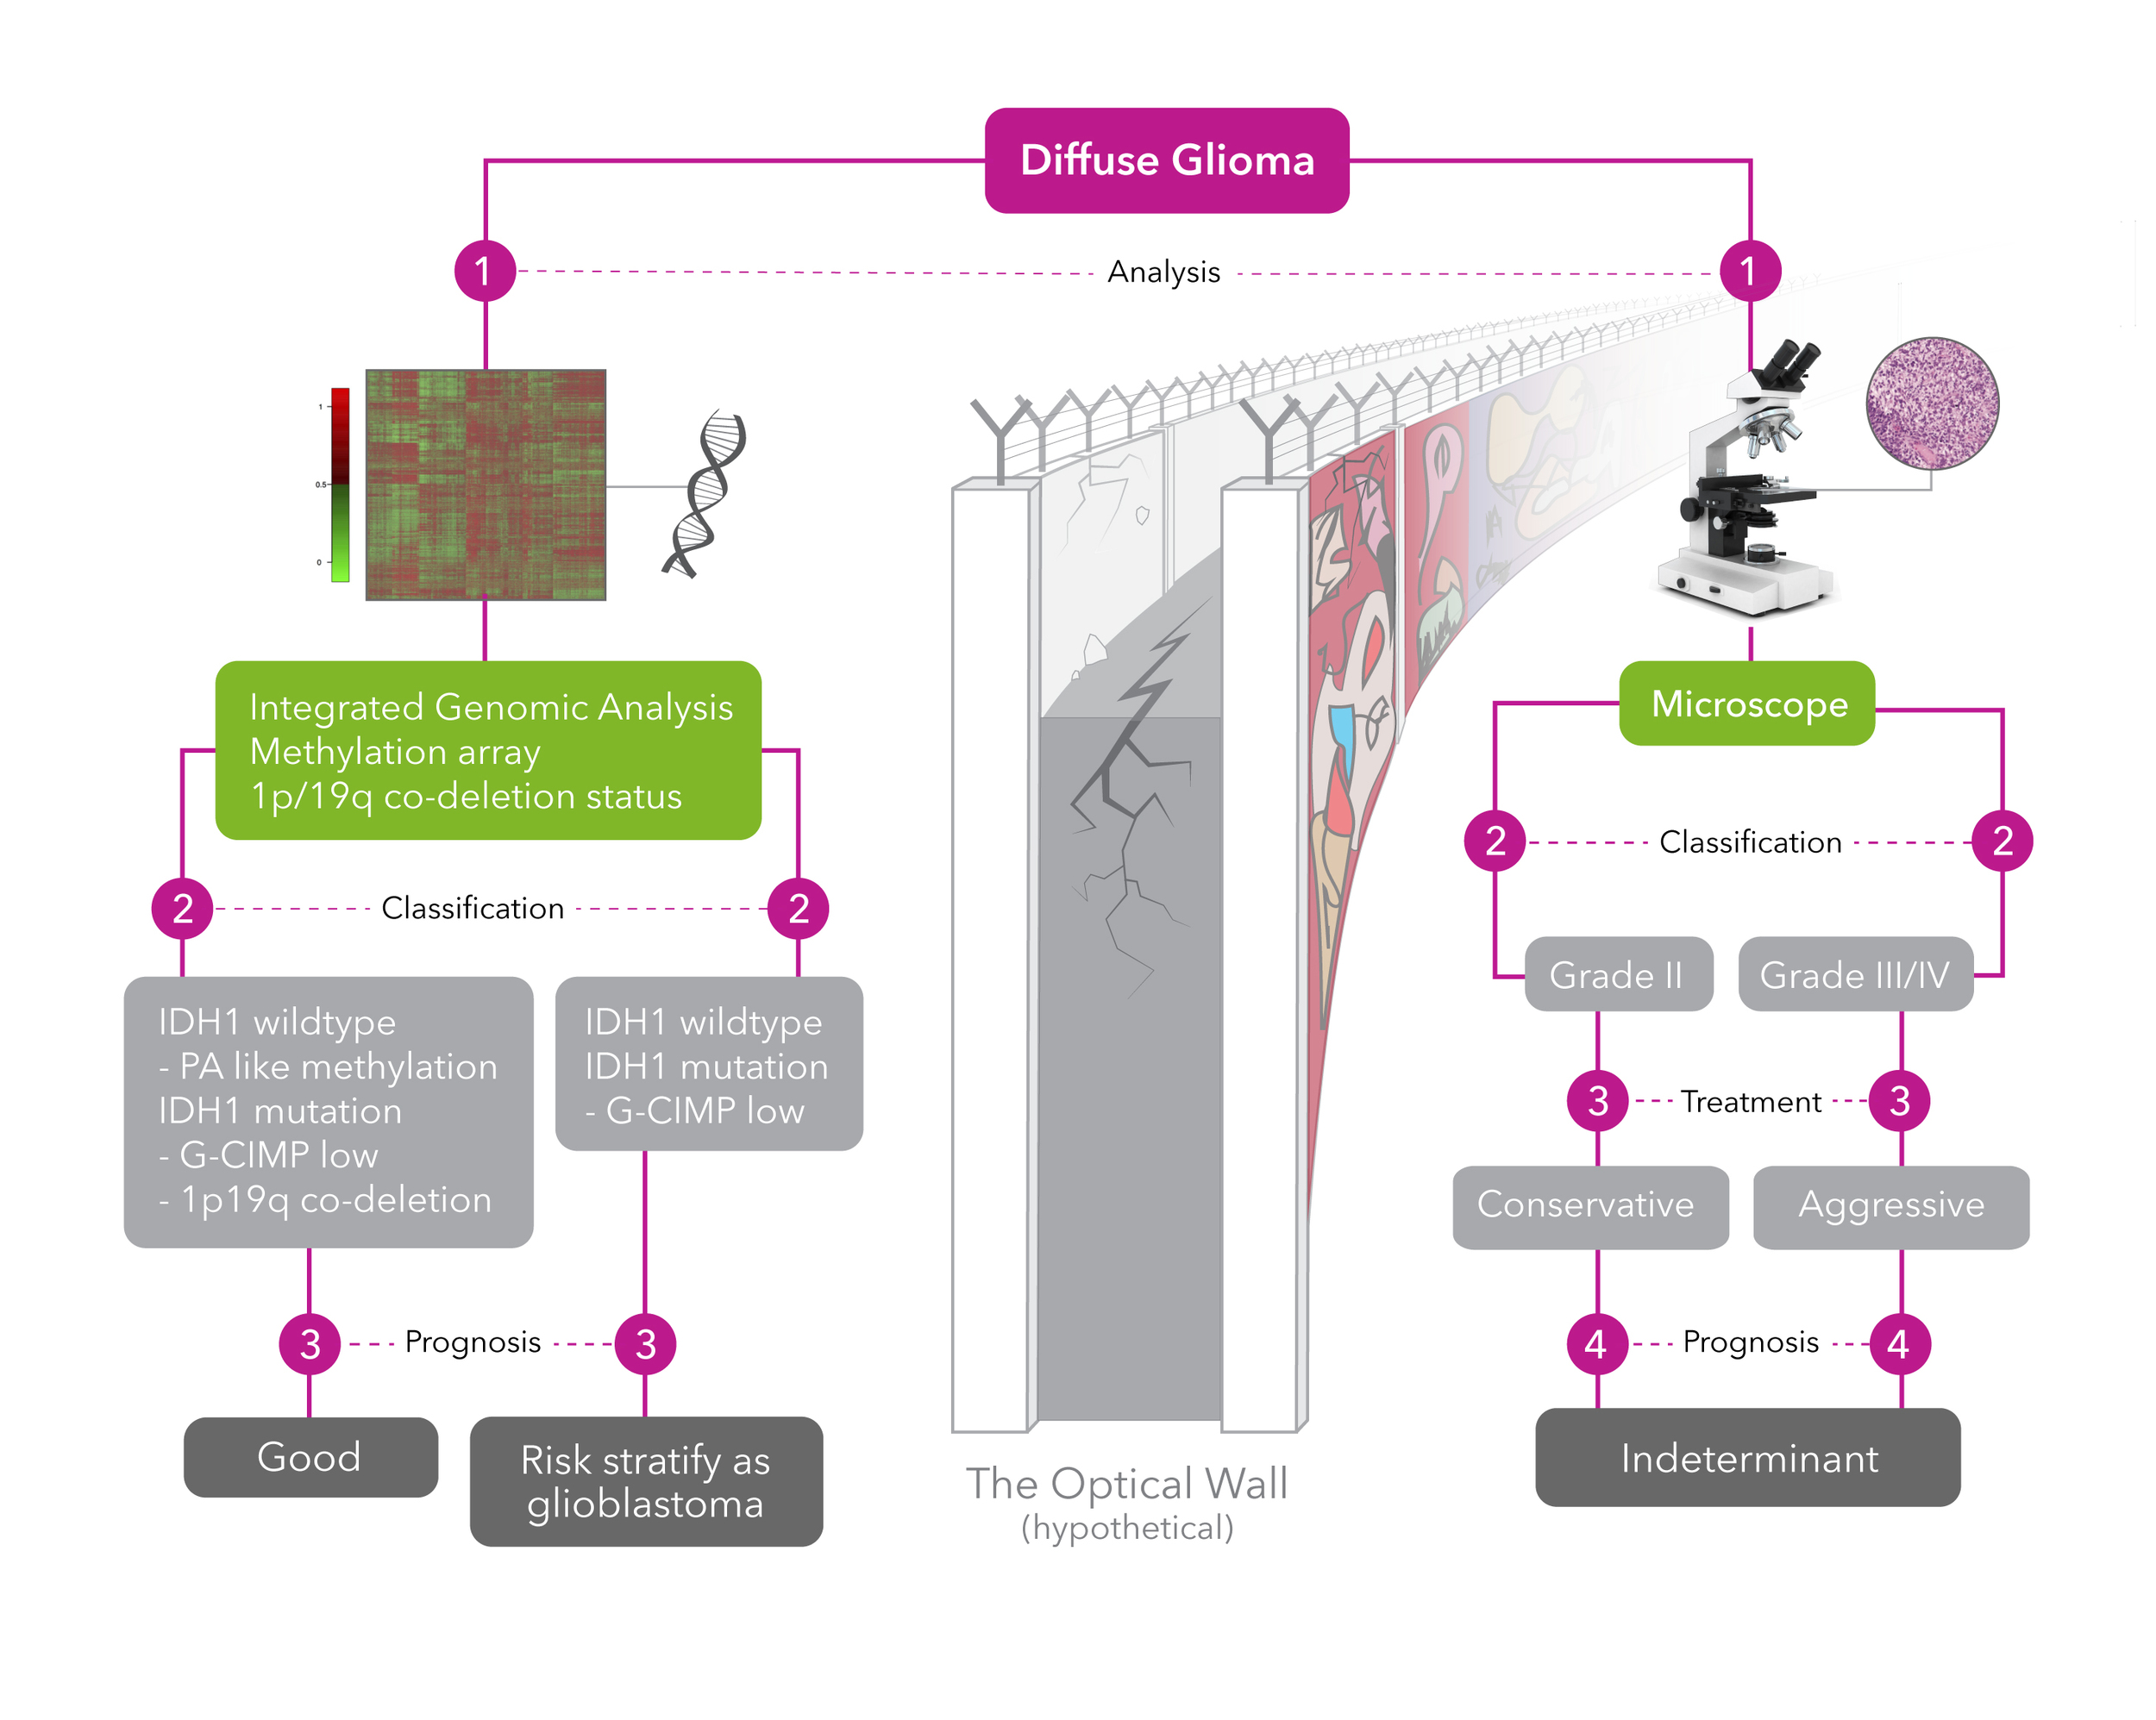
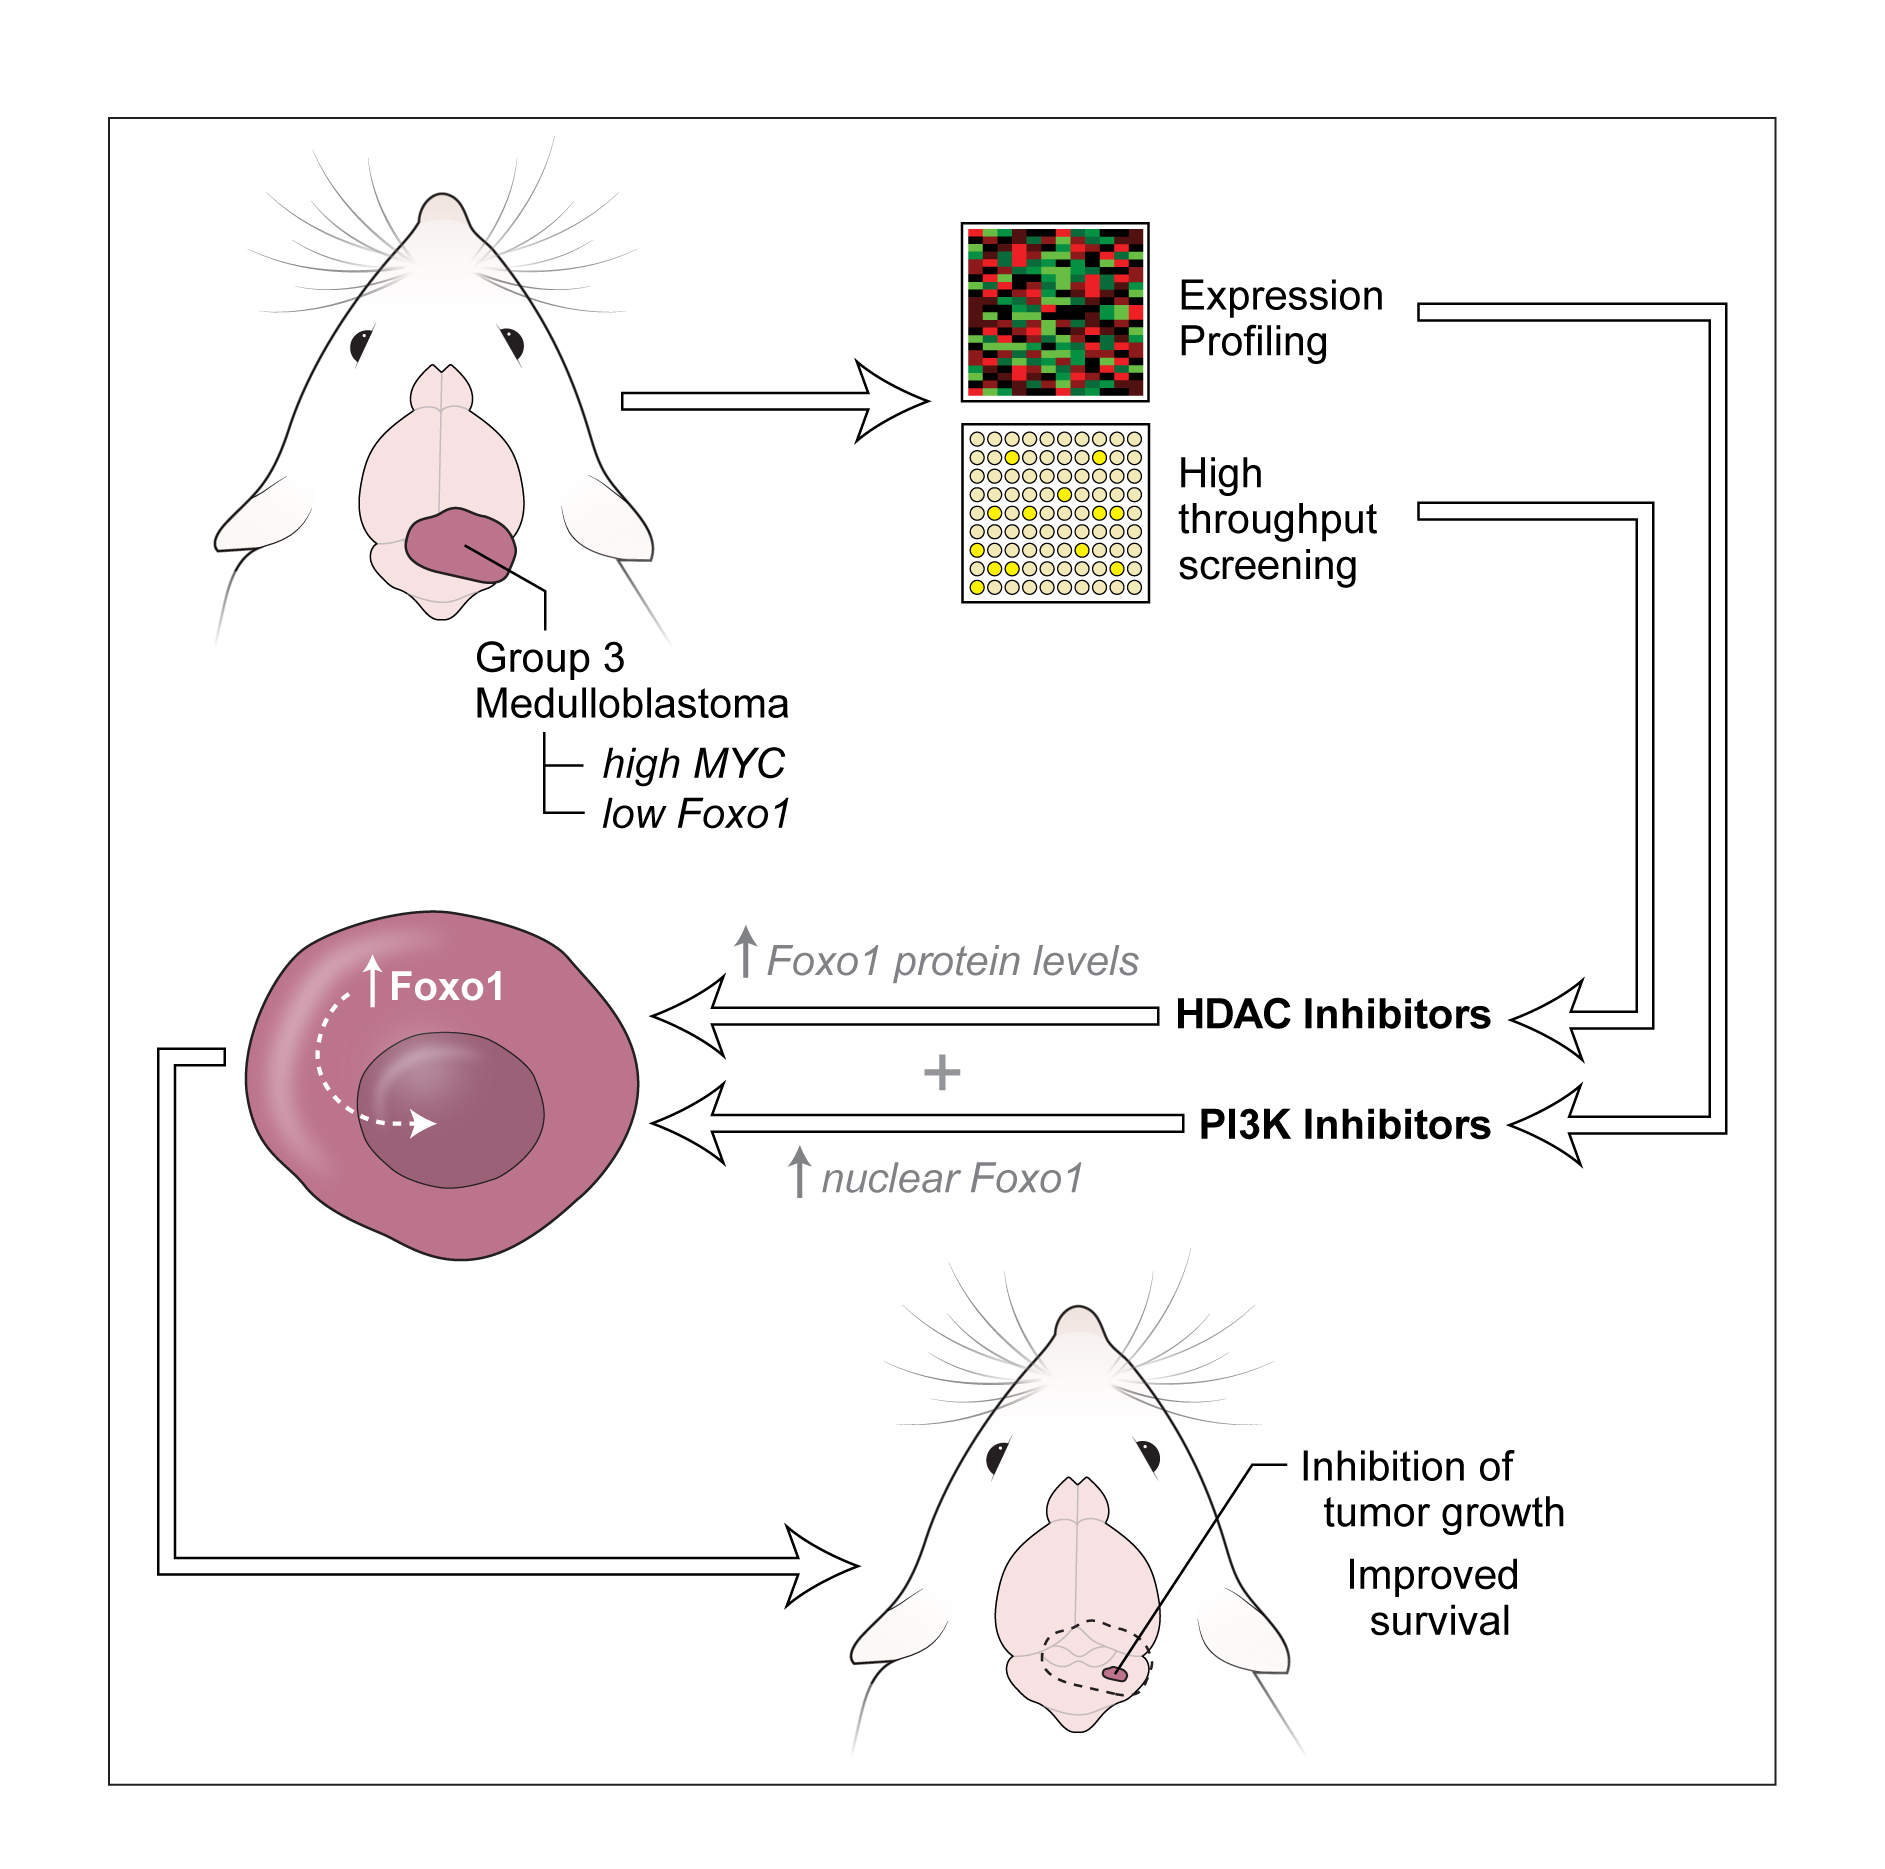
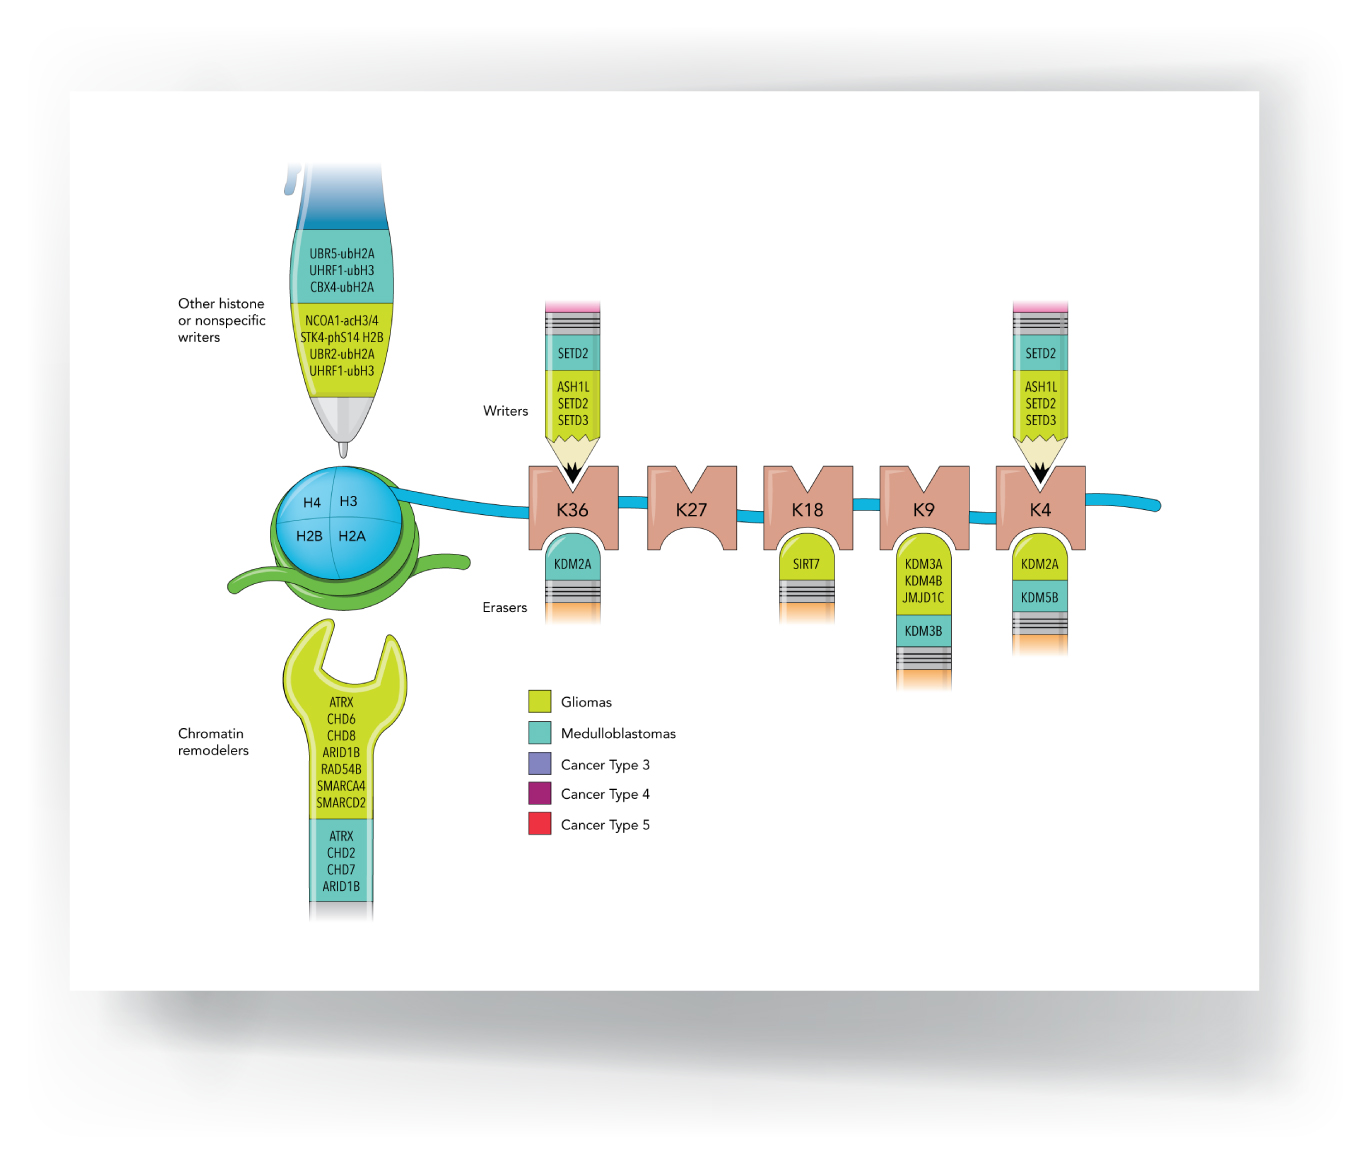
Research Figures
1
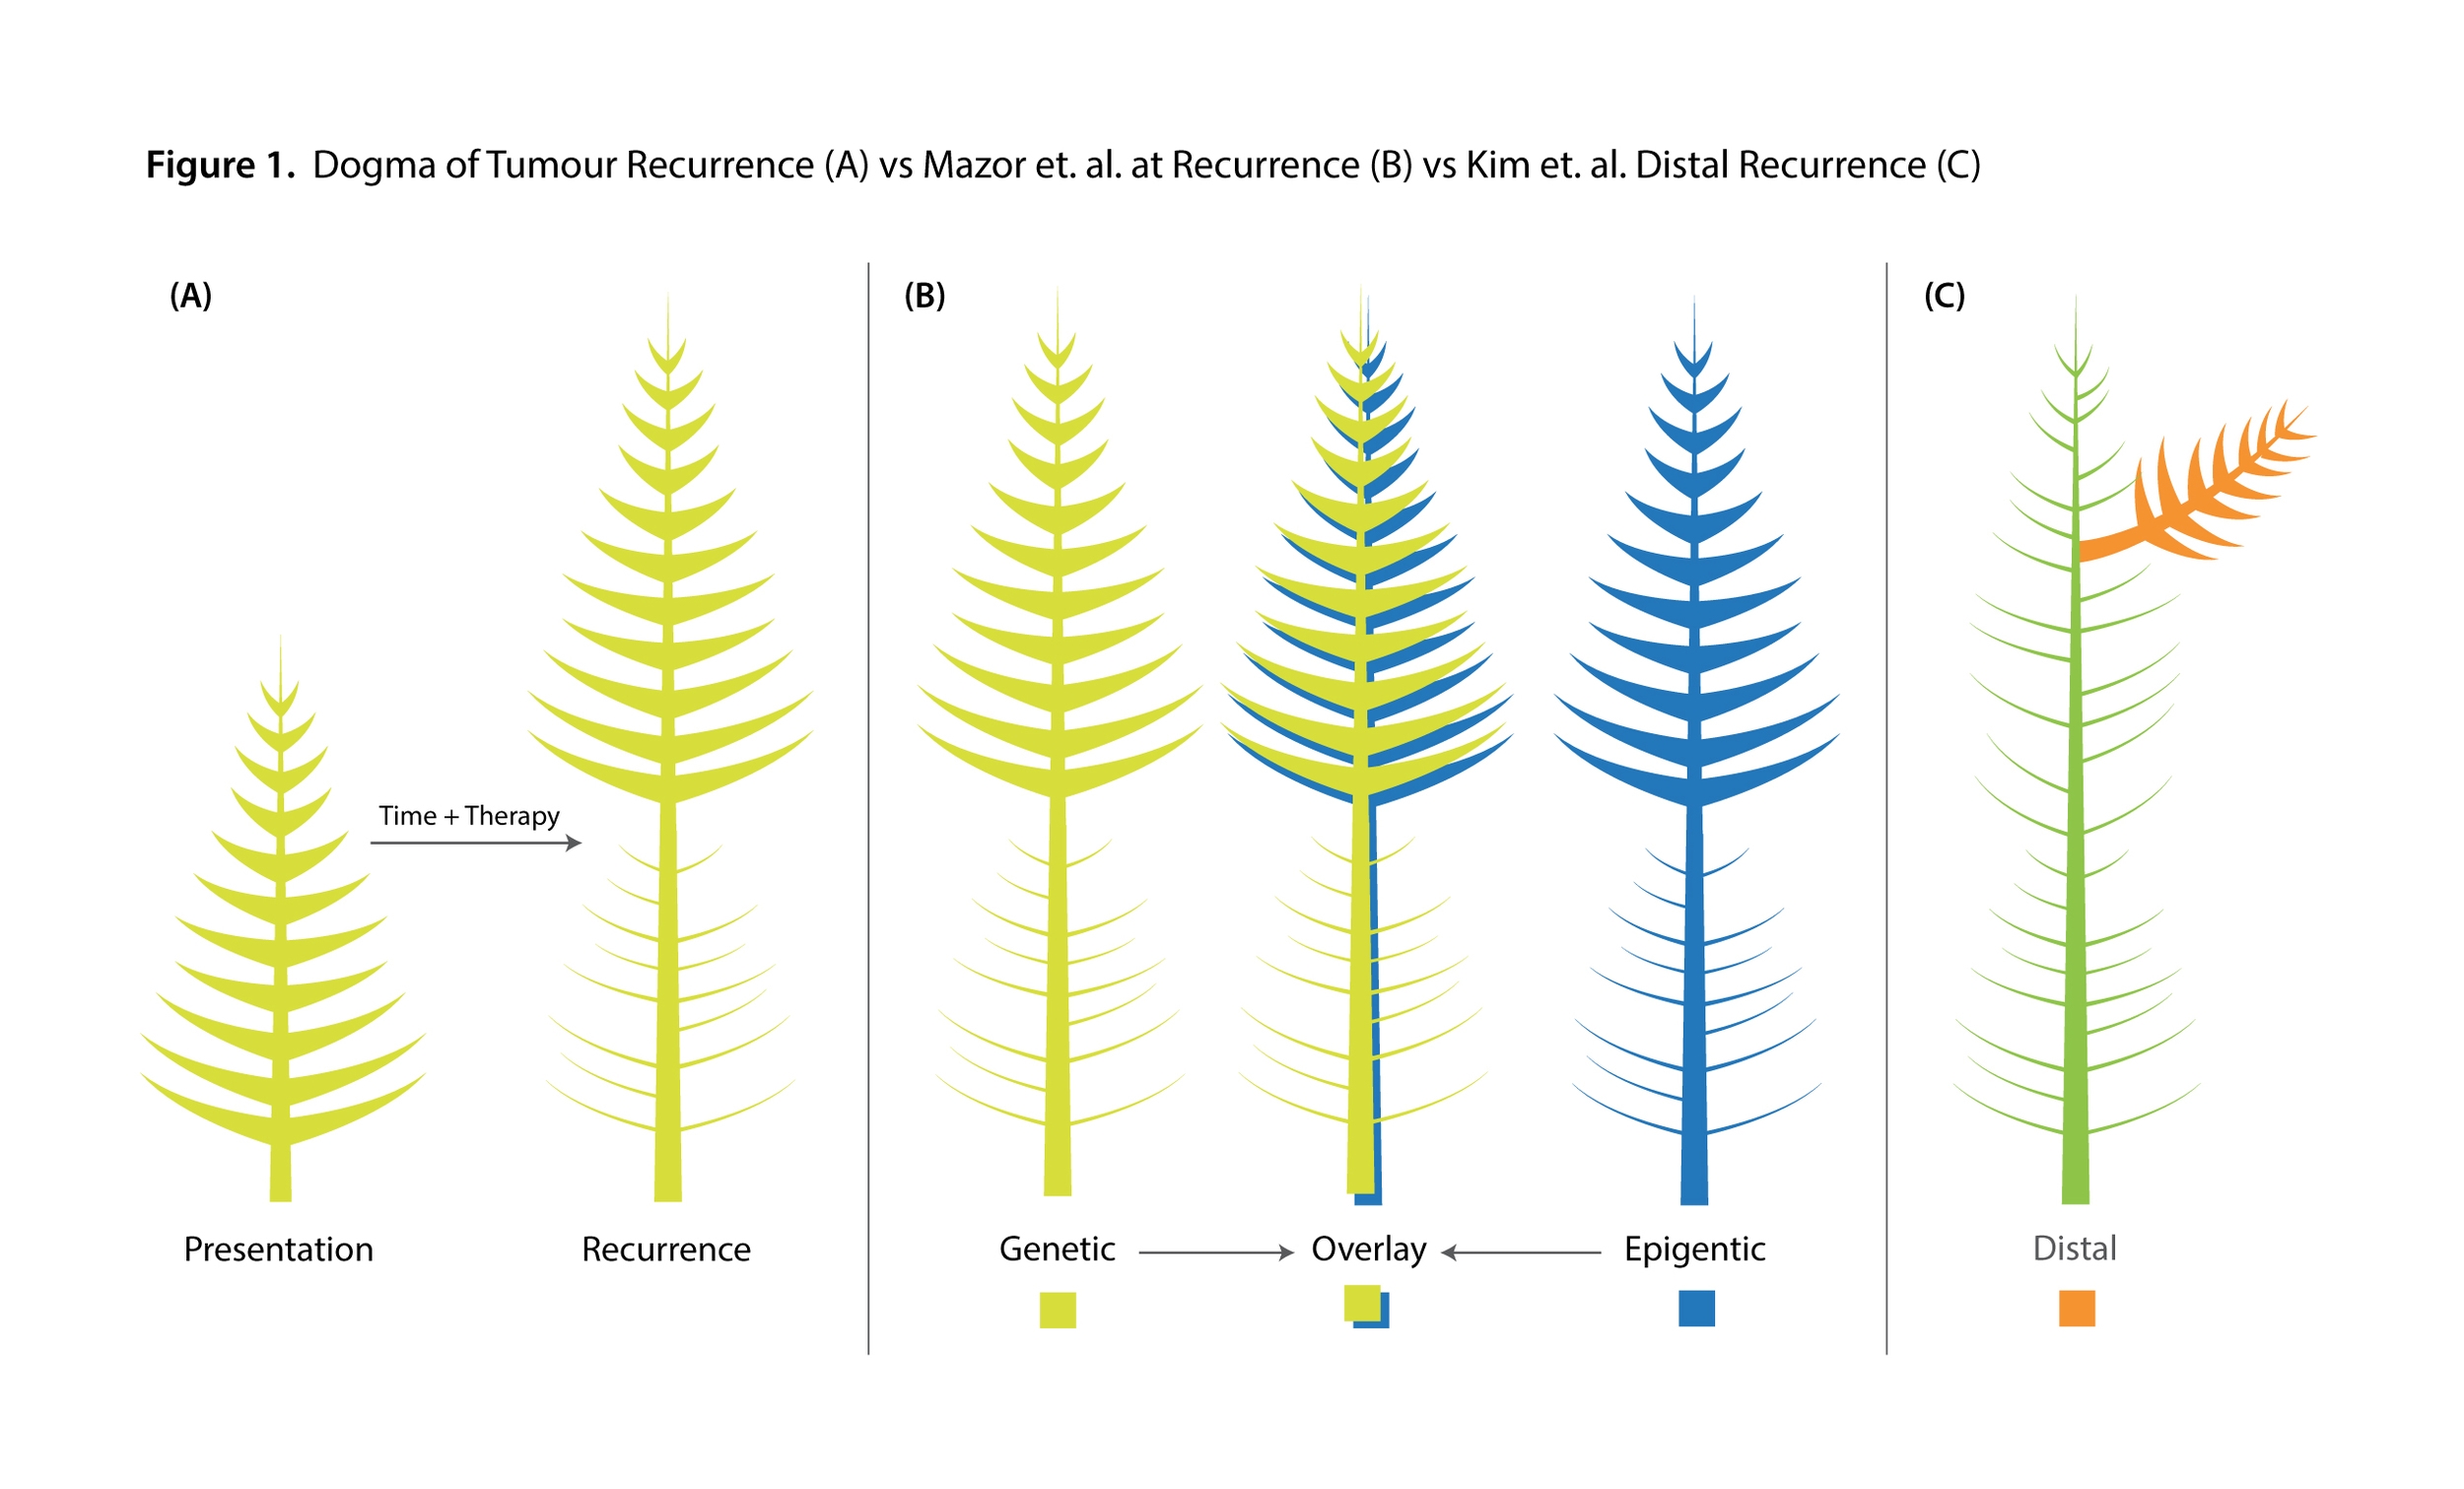
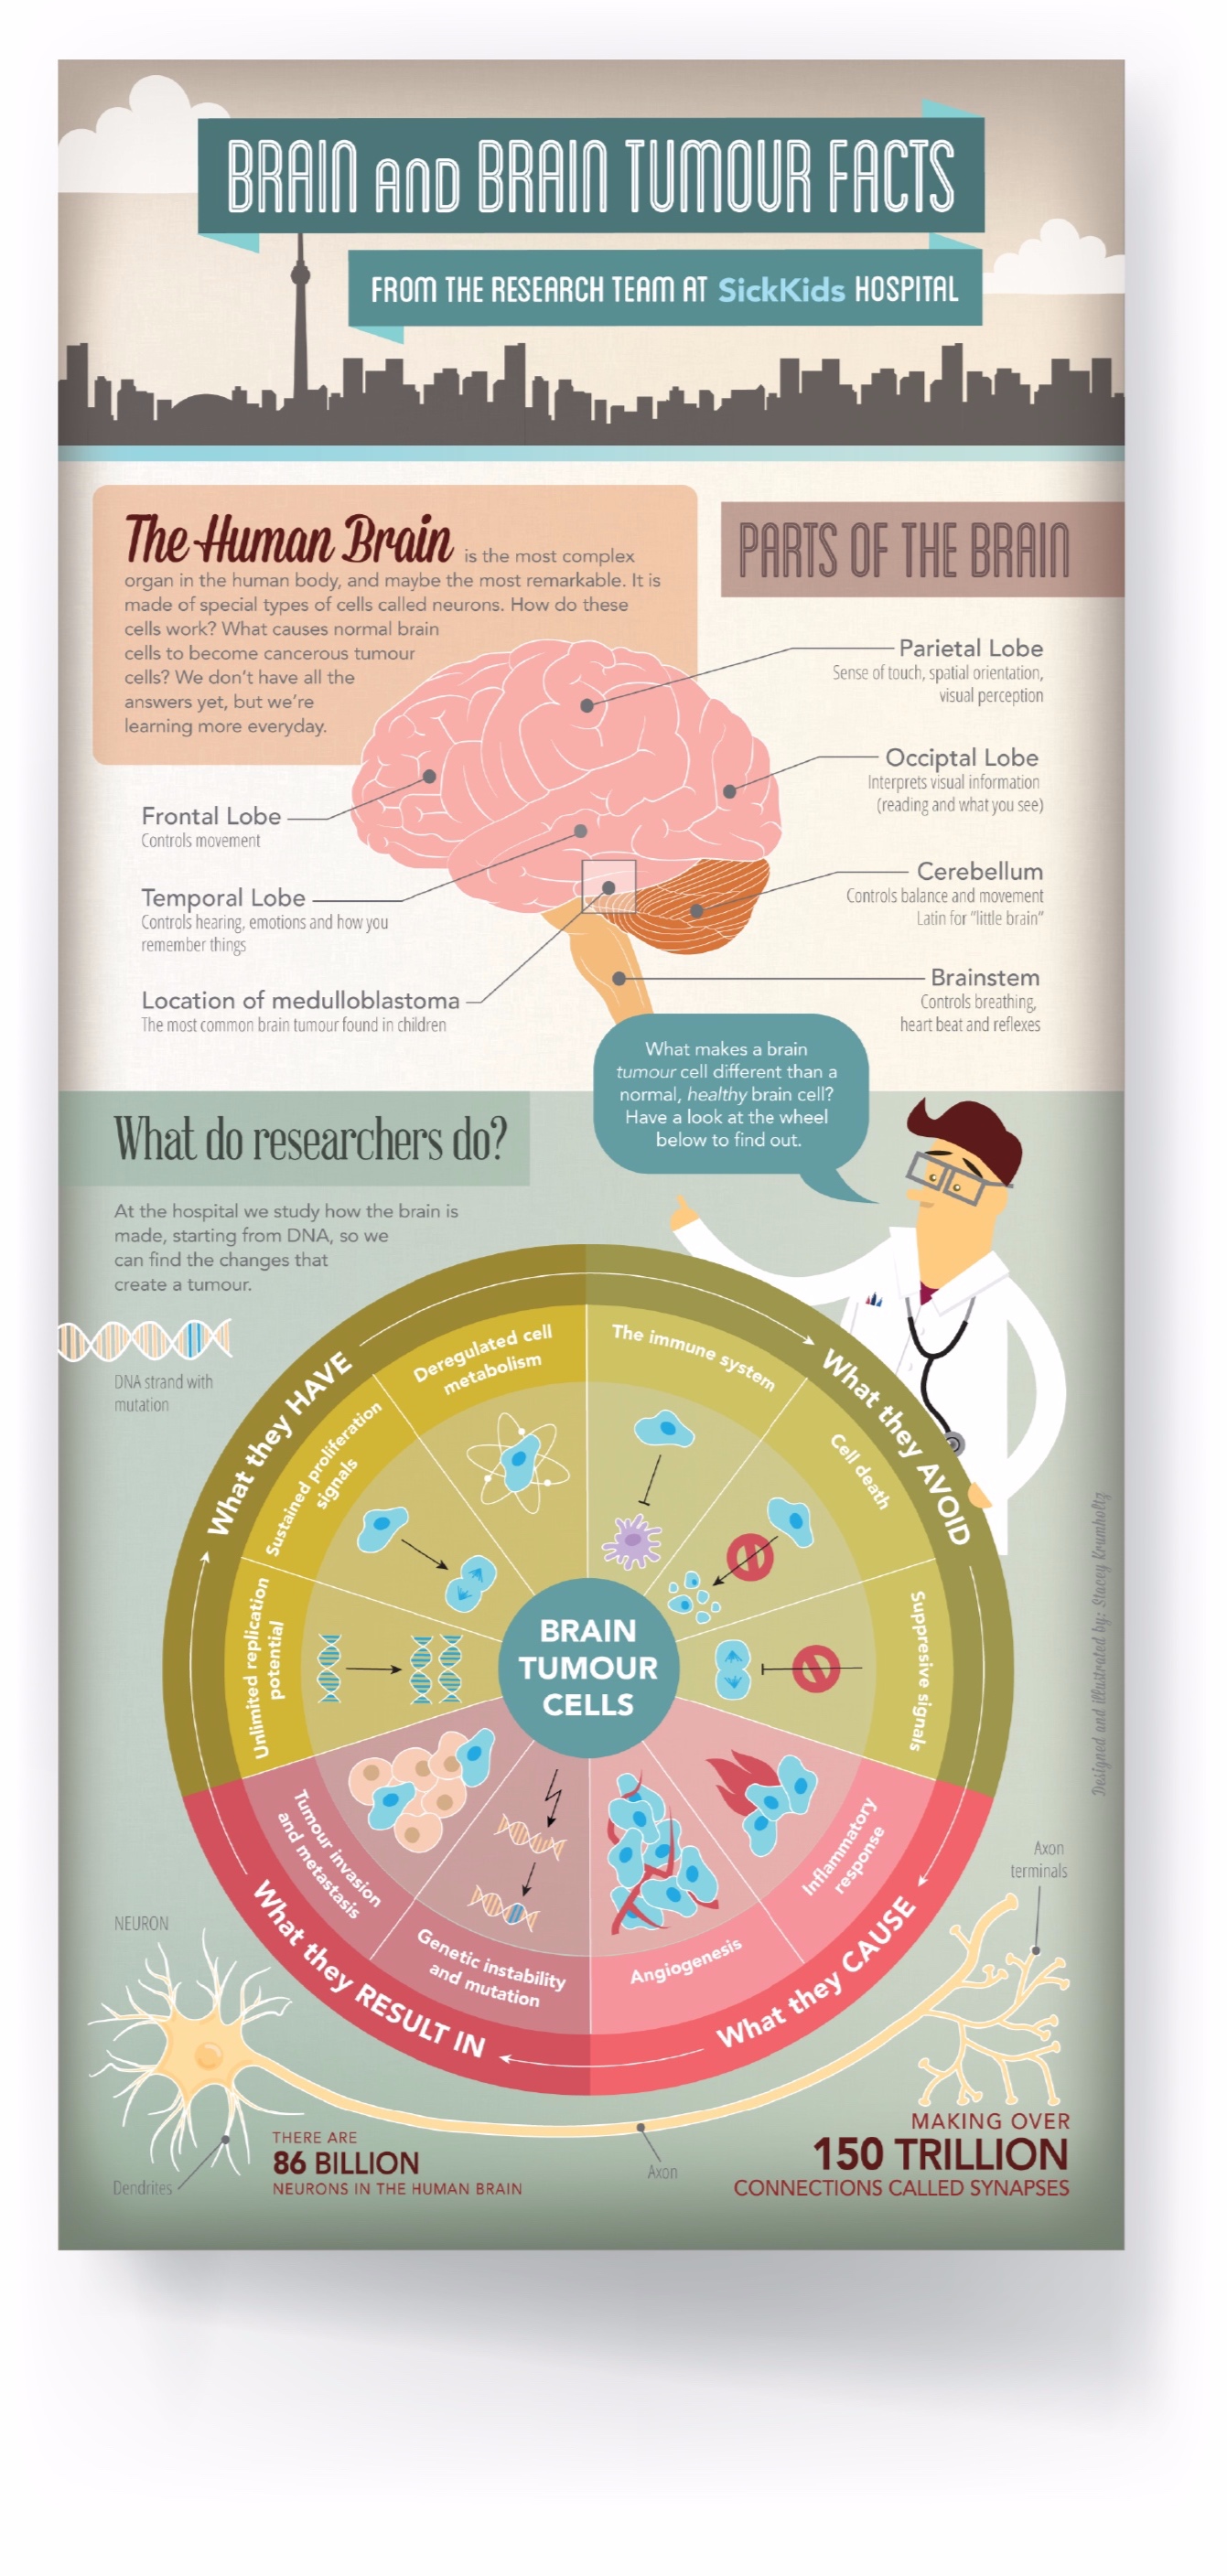
Brain Tumour Facts

1
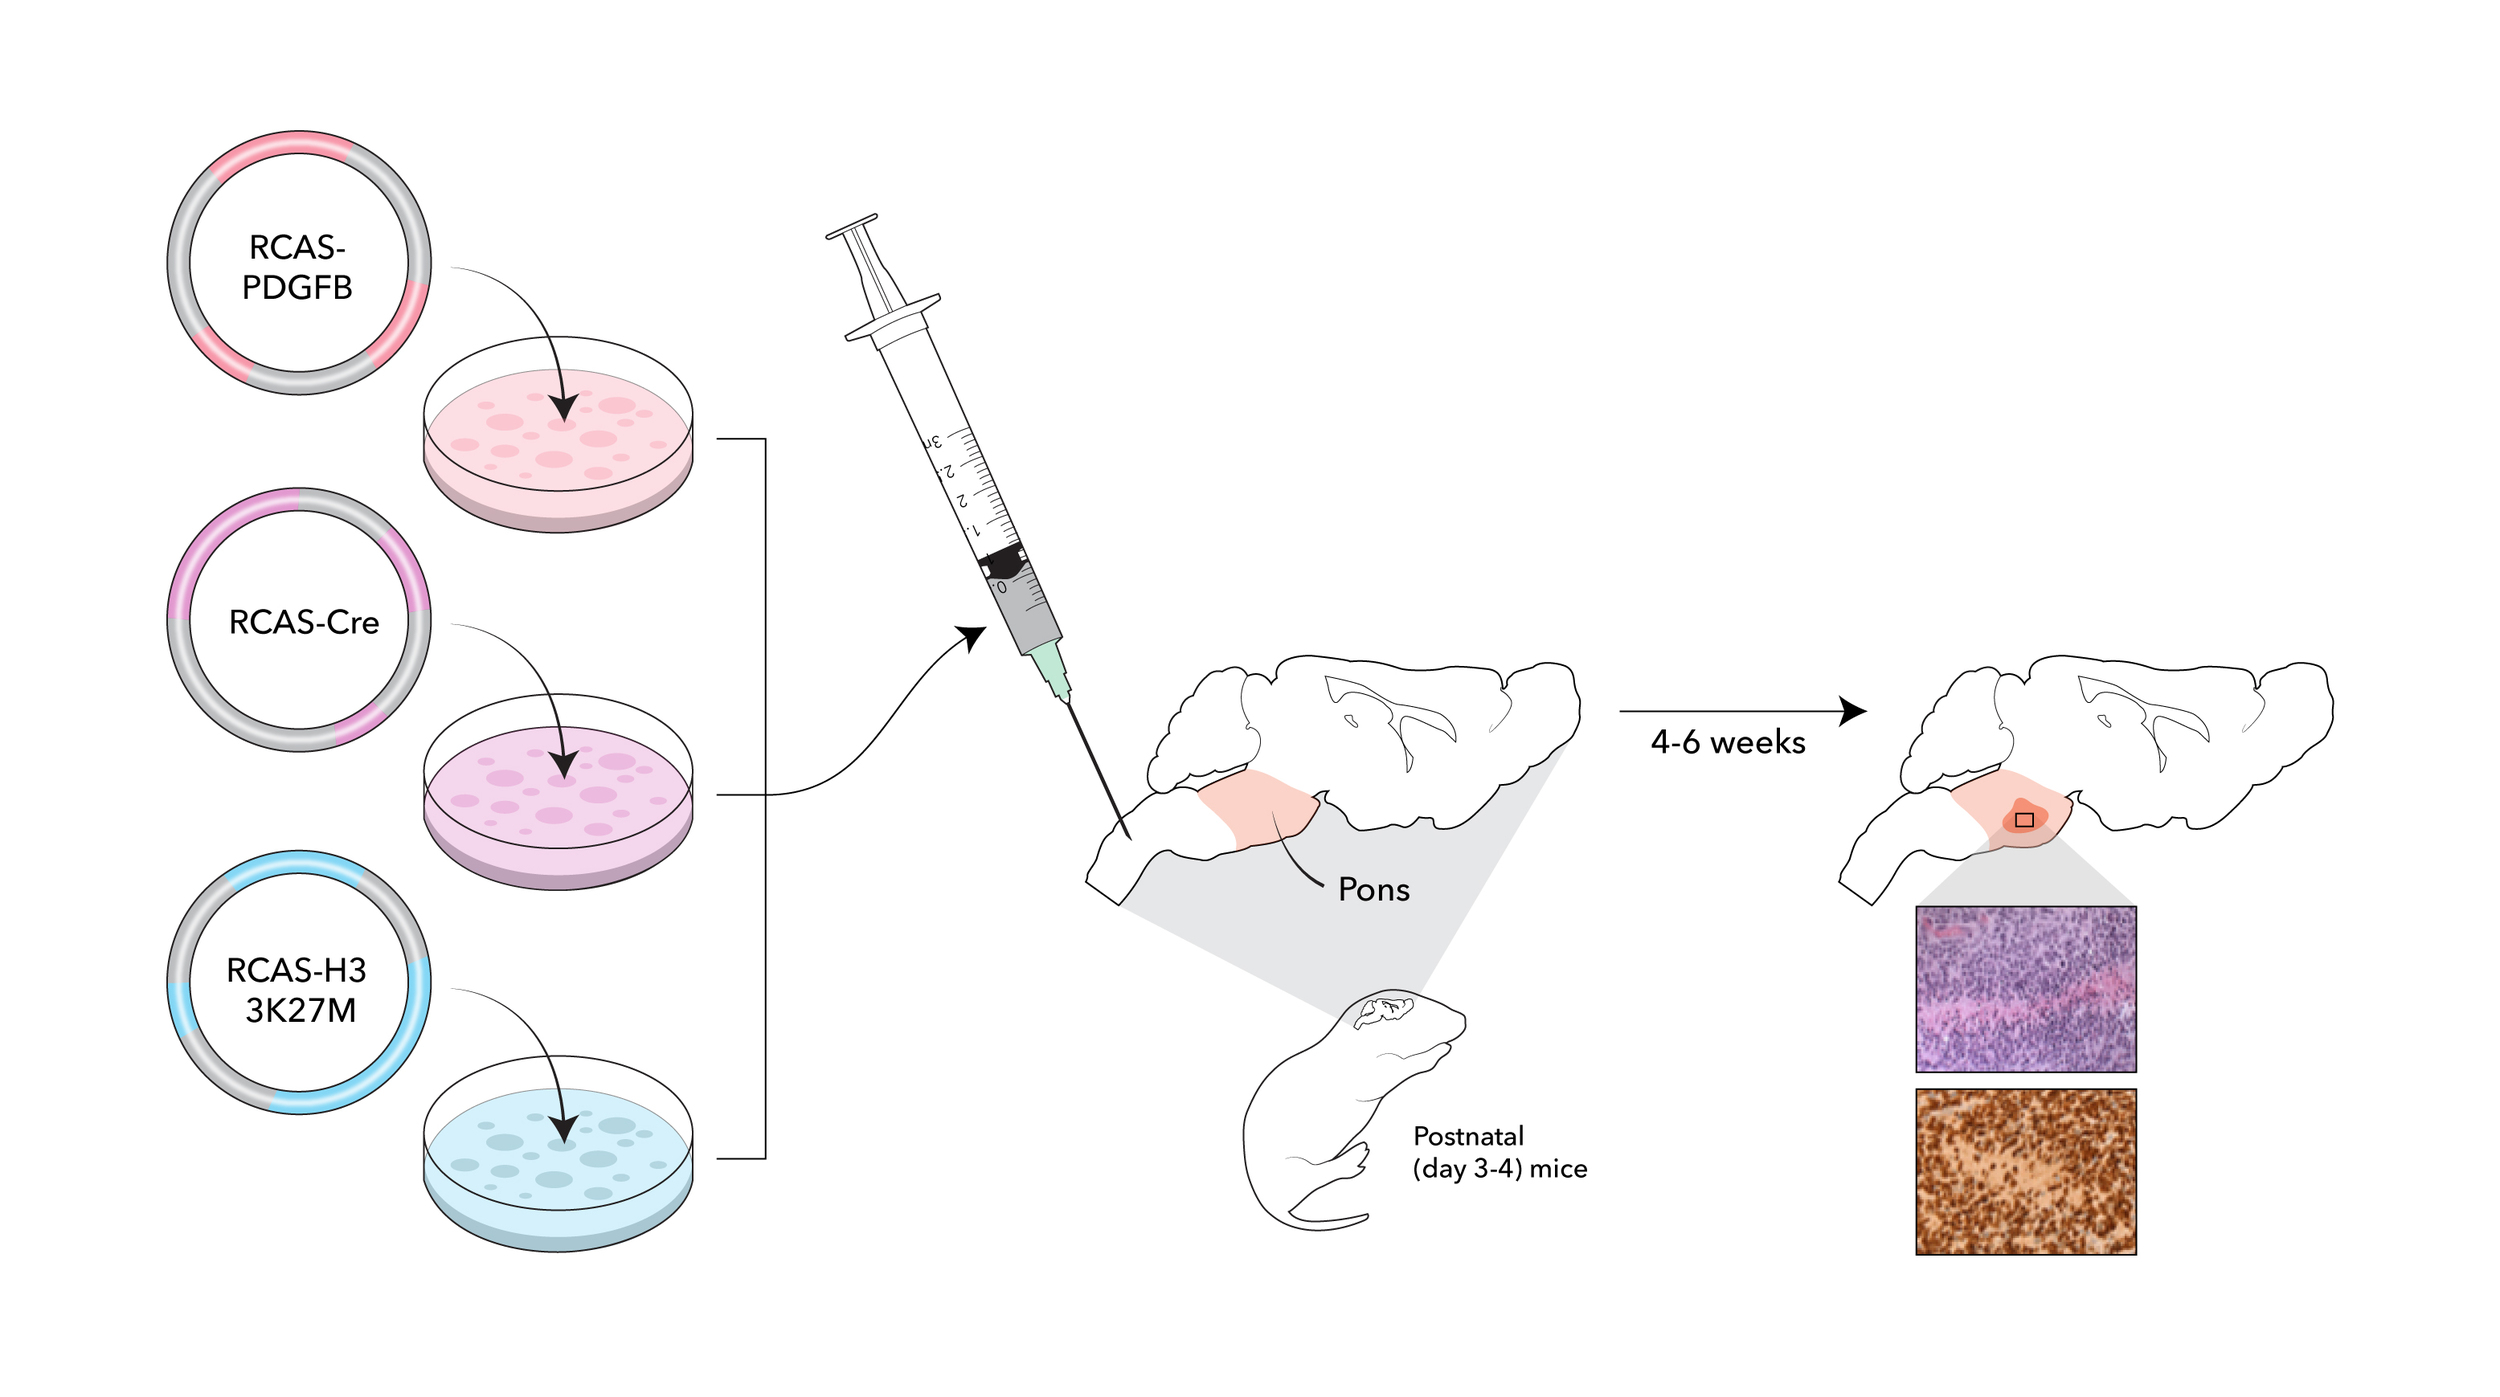
New Research
1
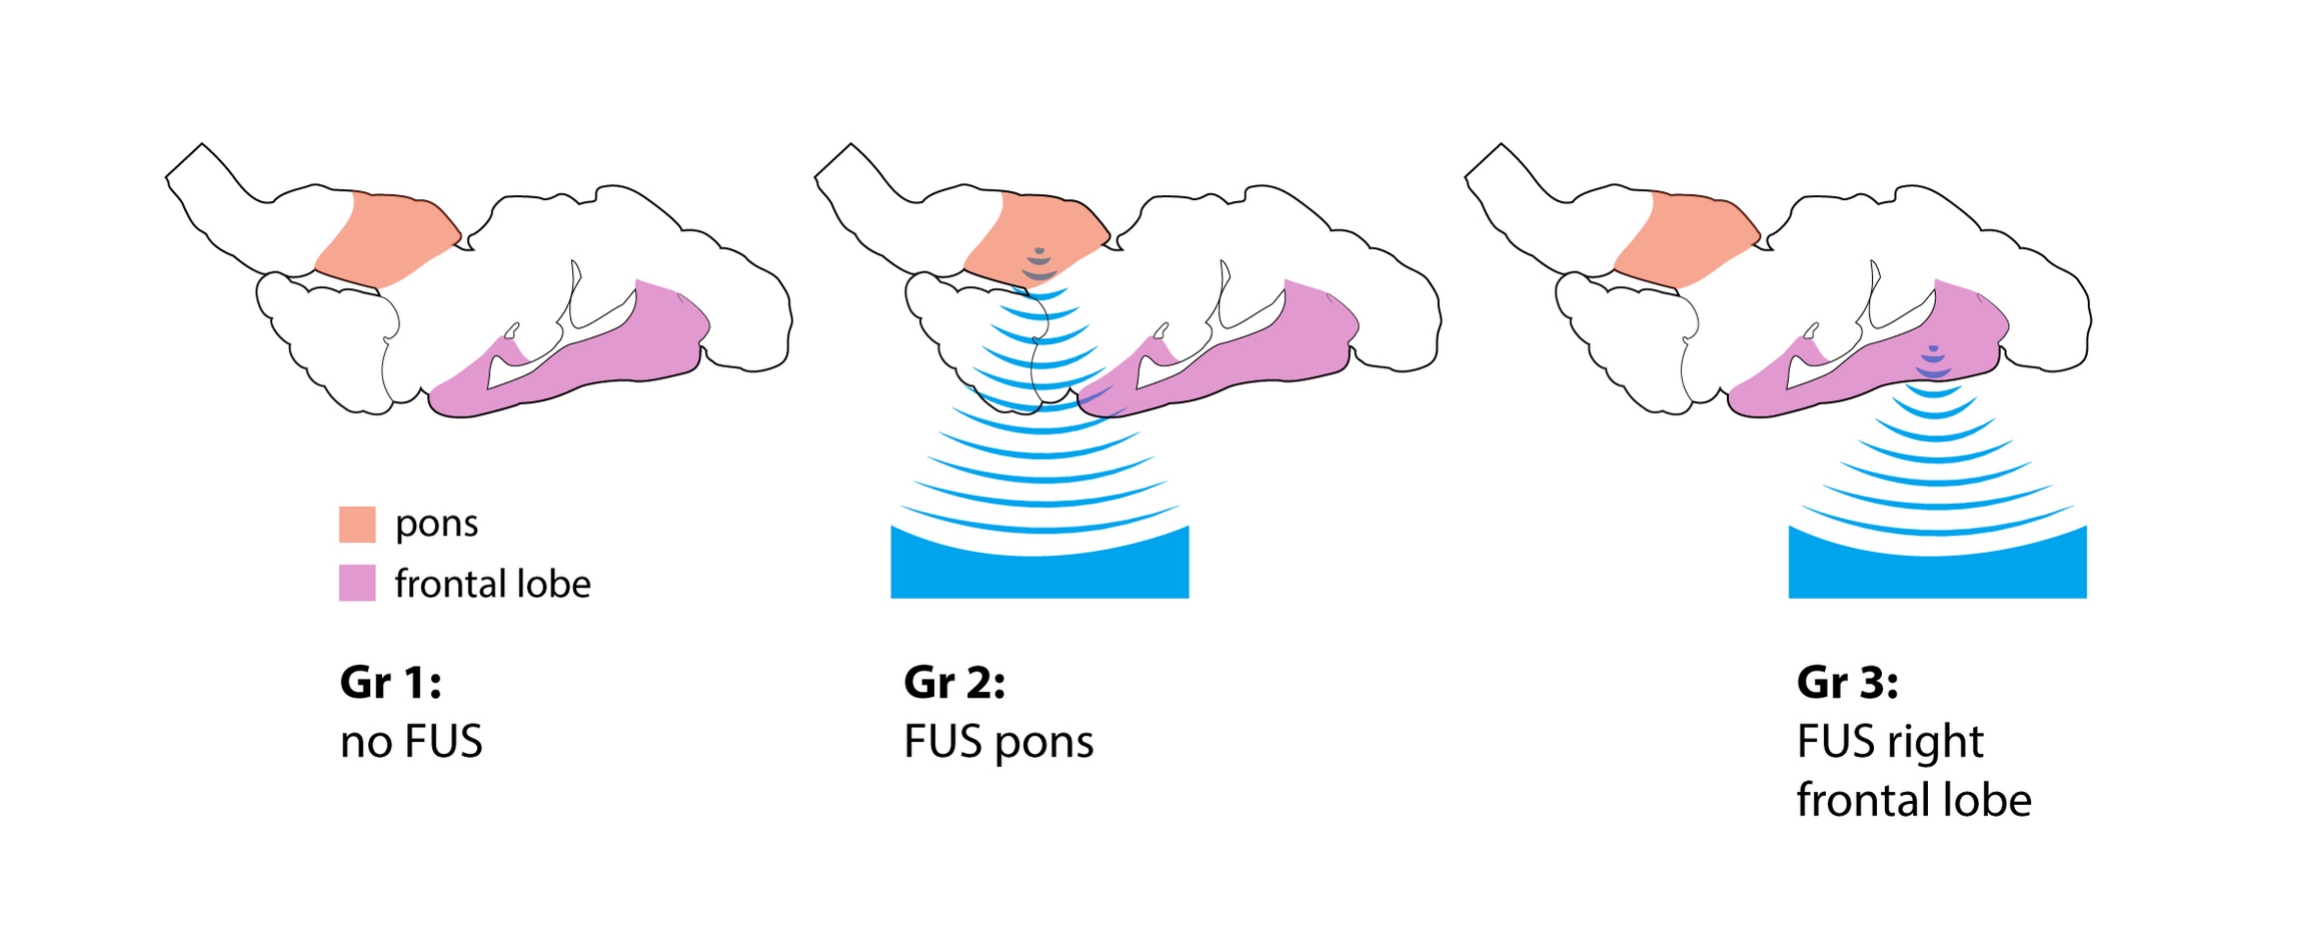
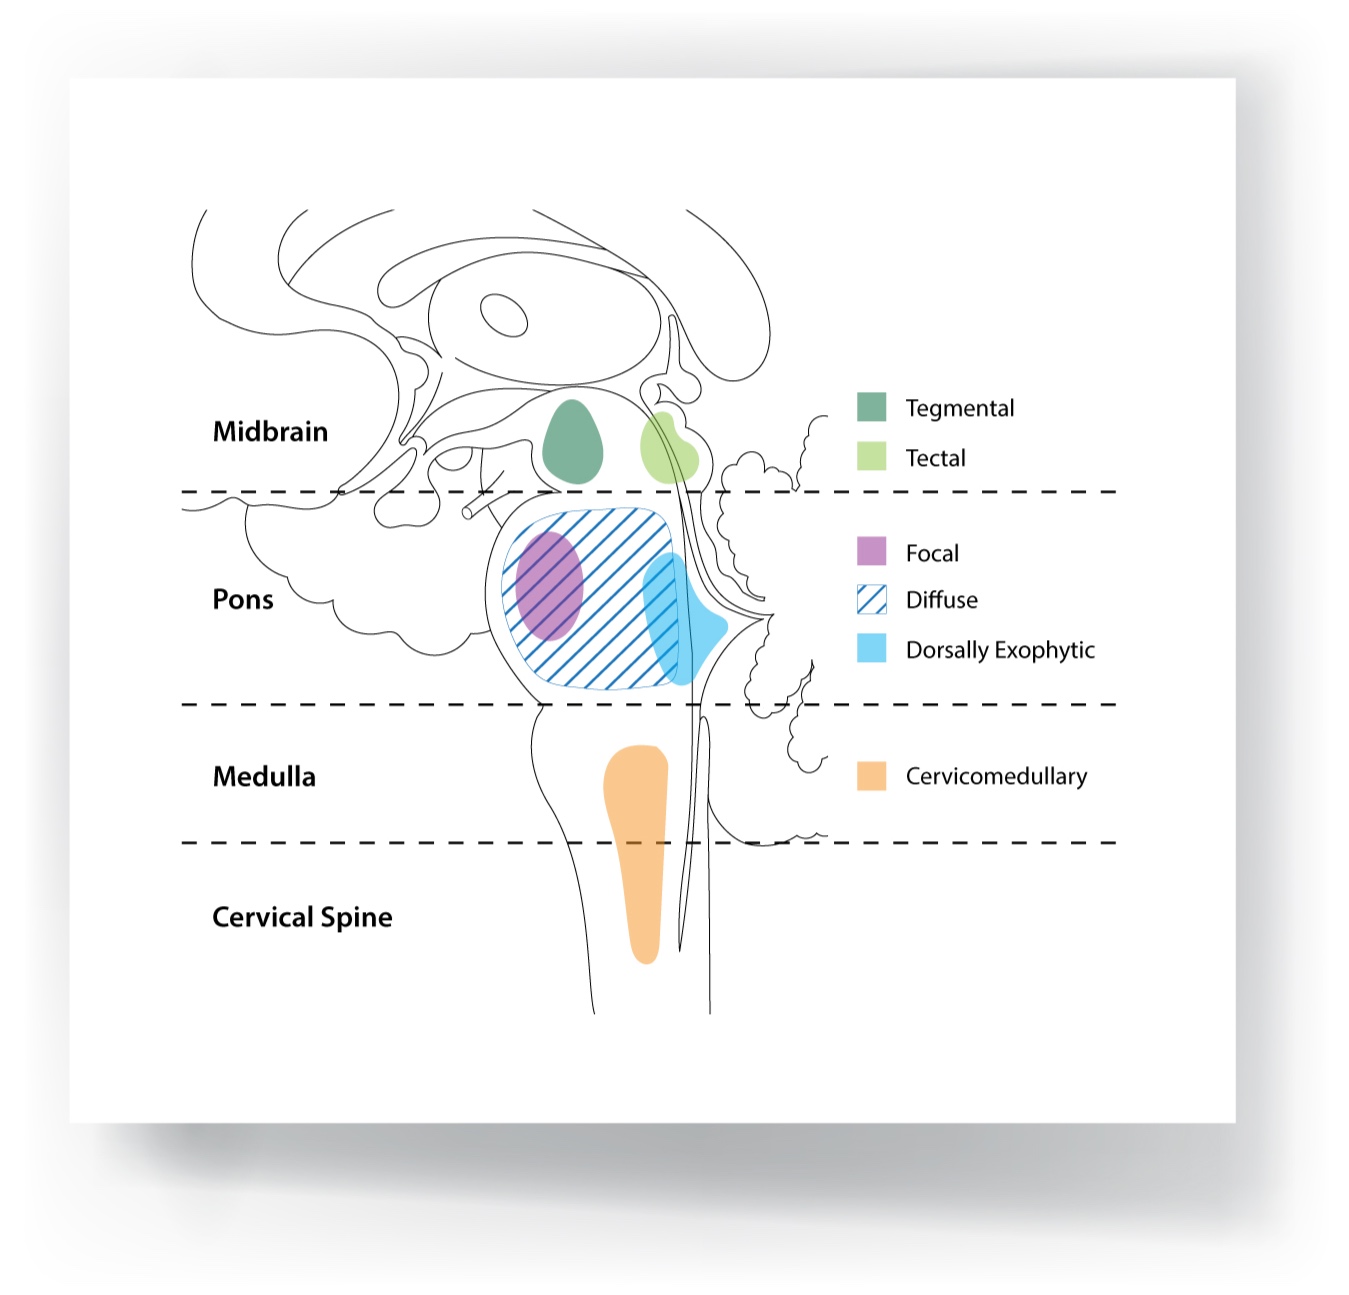
Tumours of the Brainstem

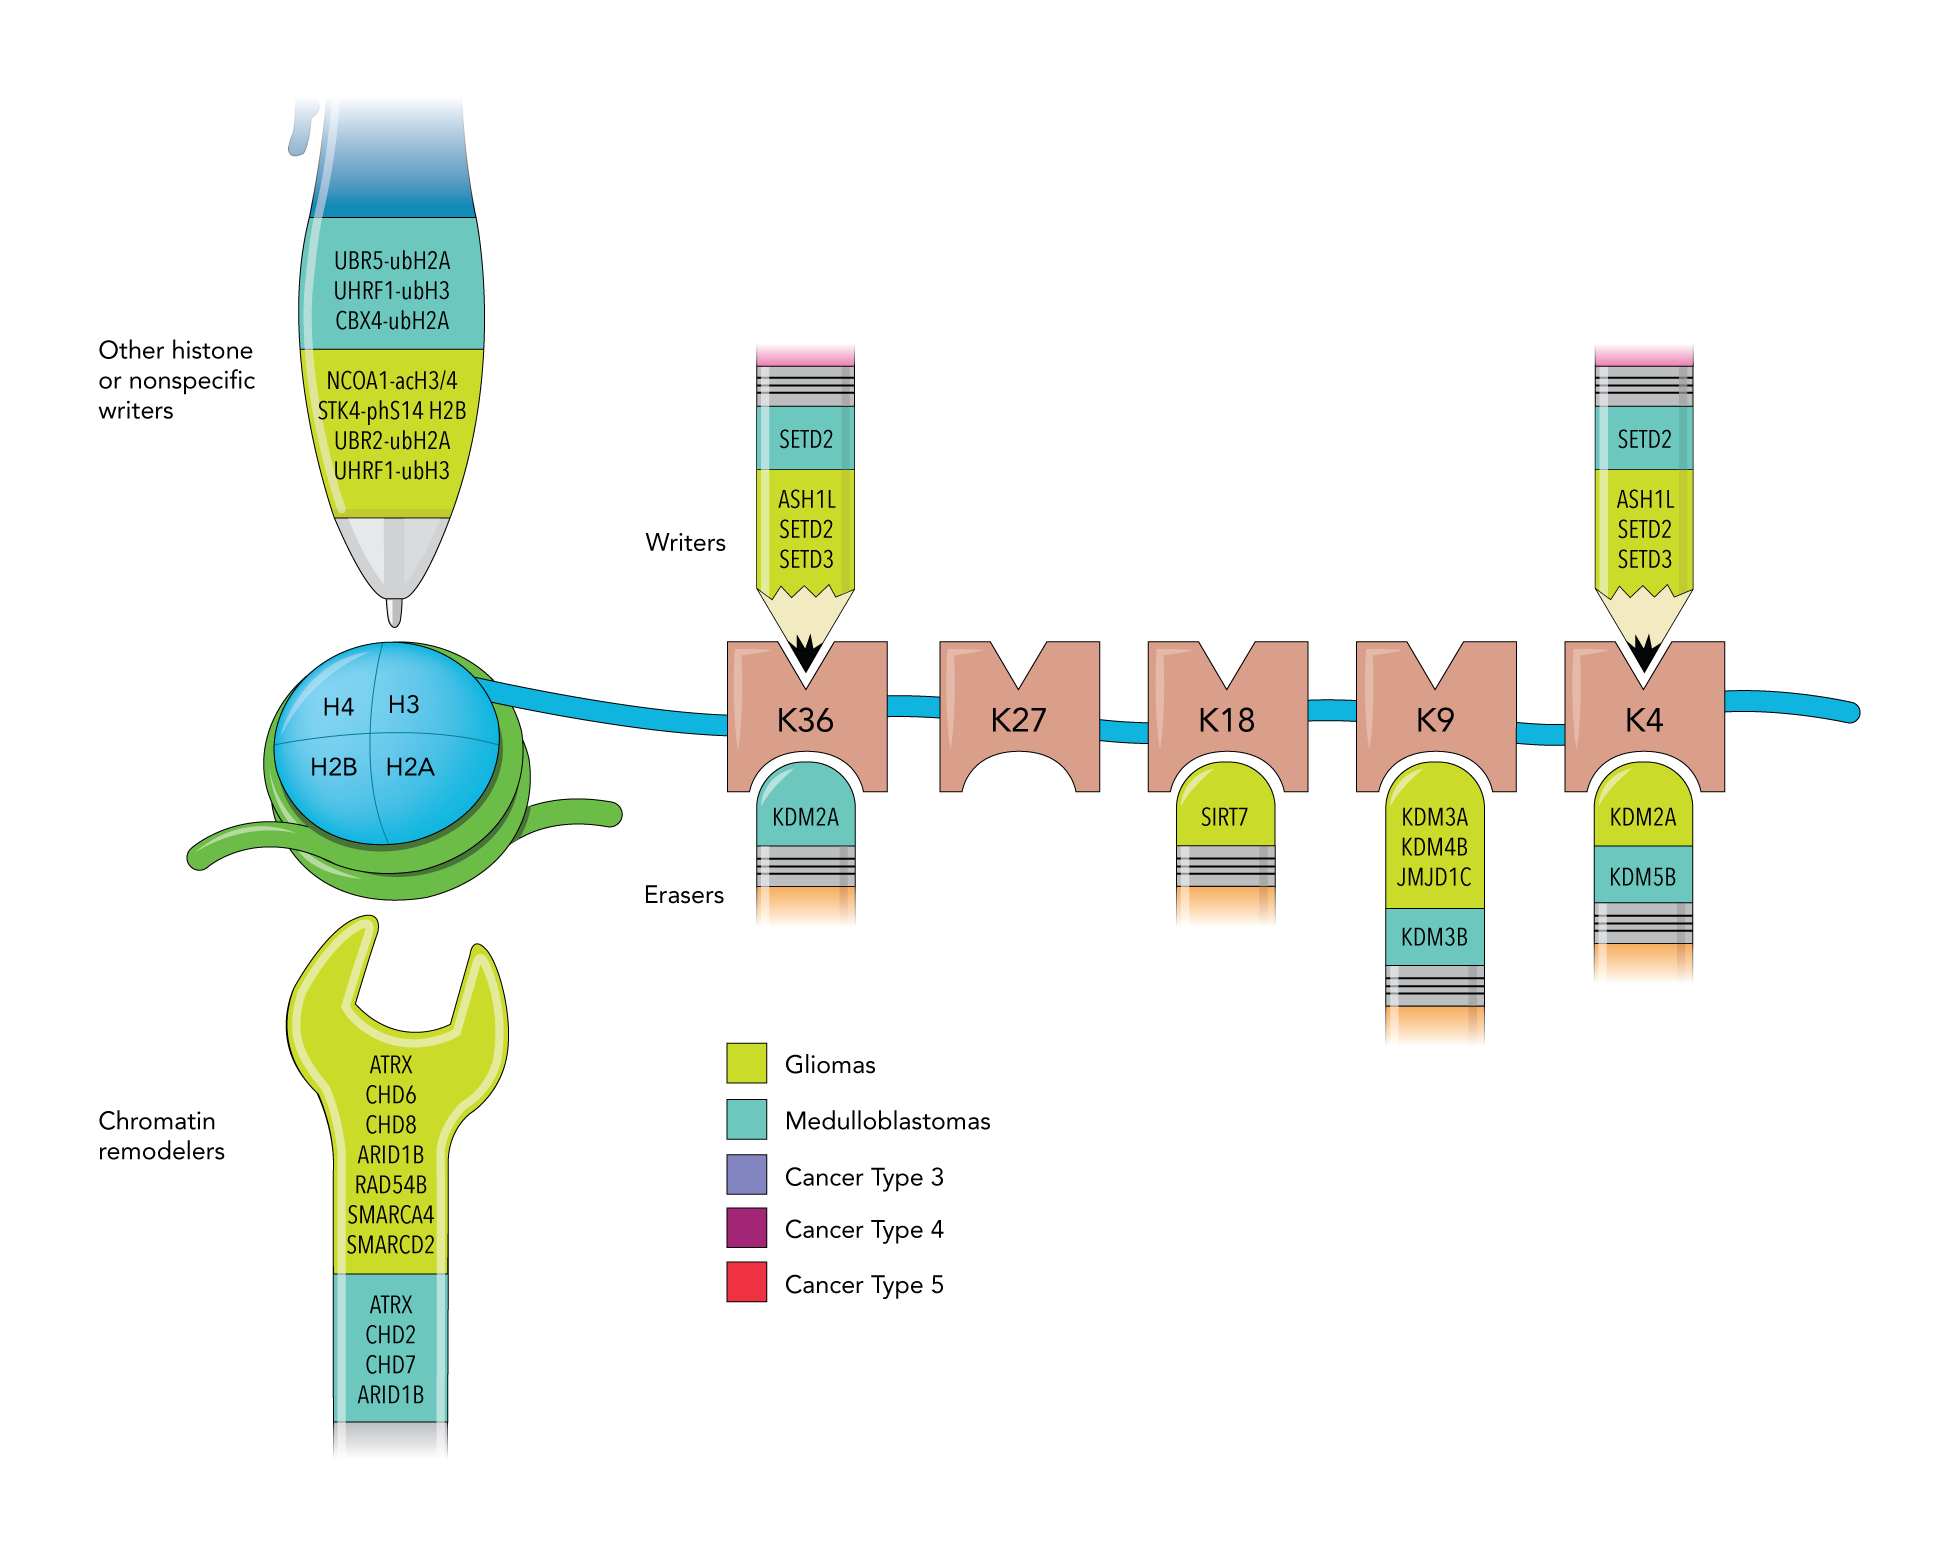
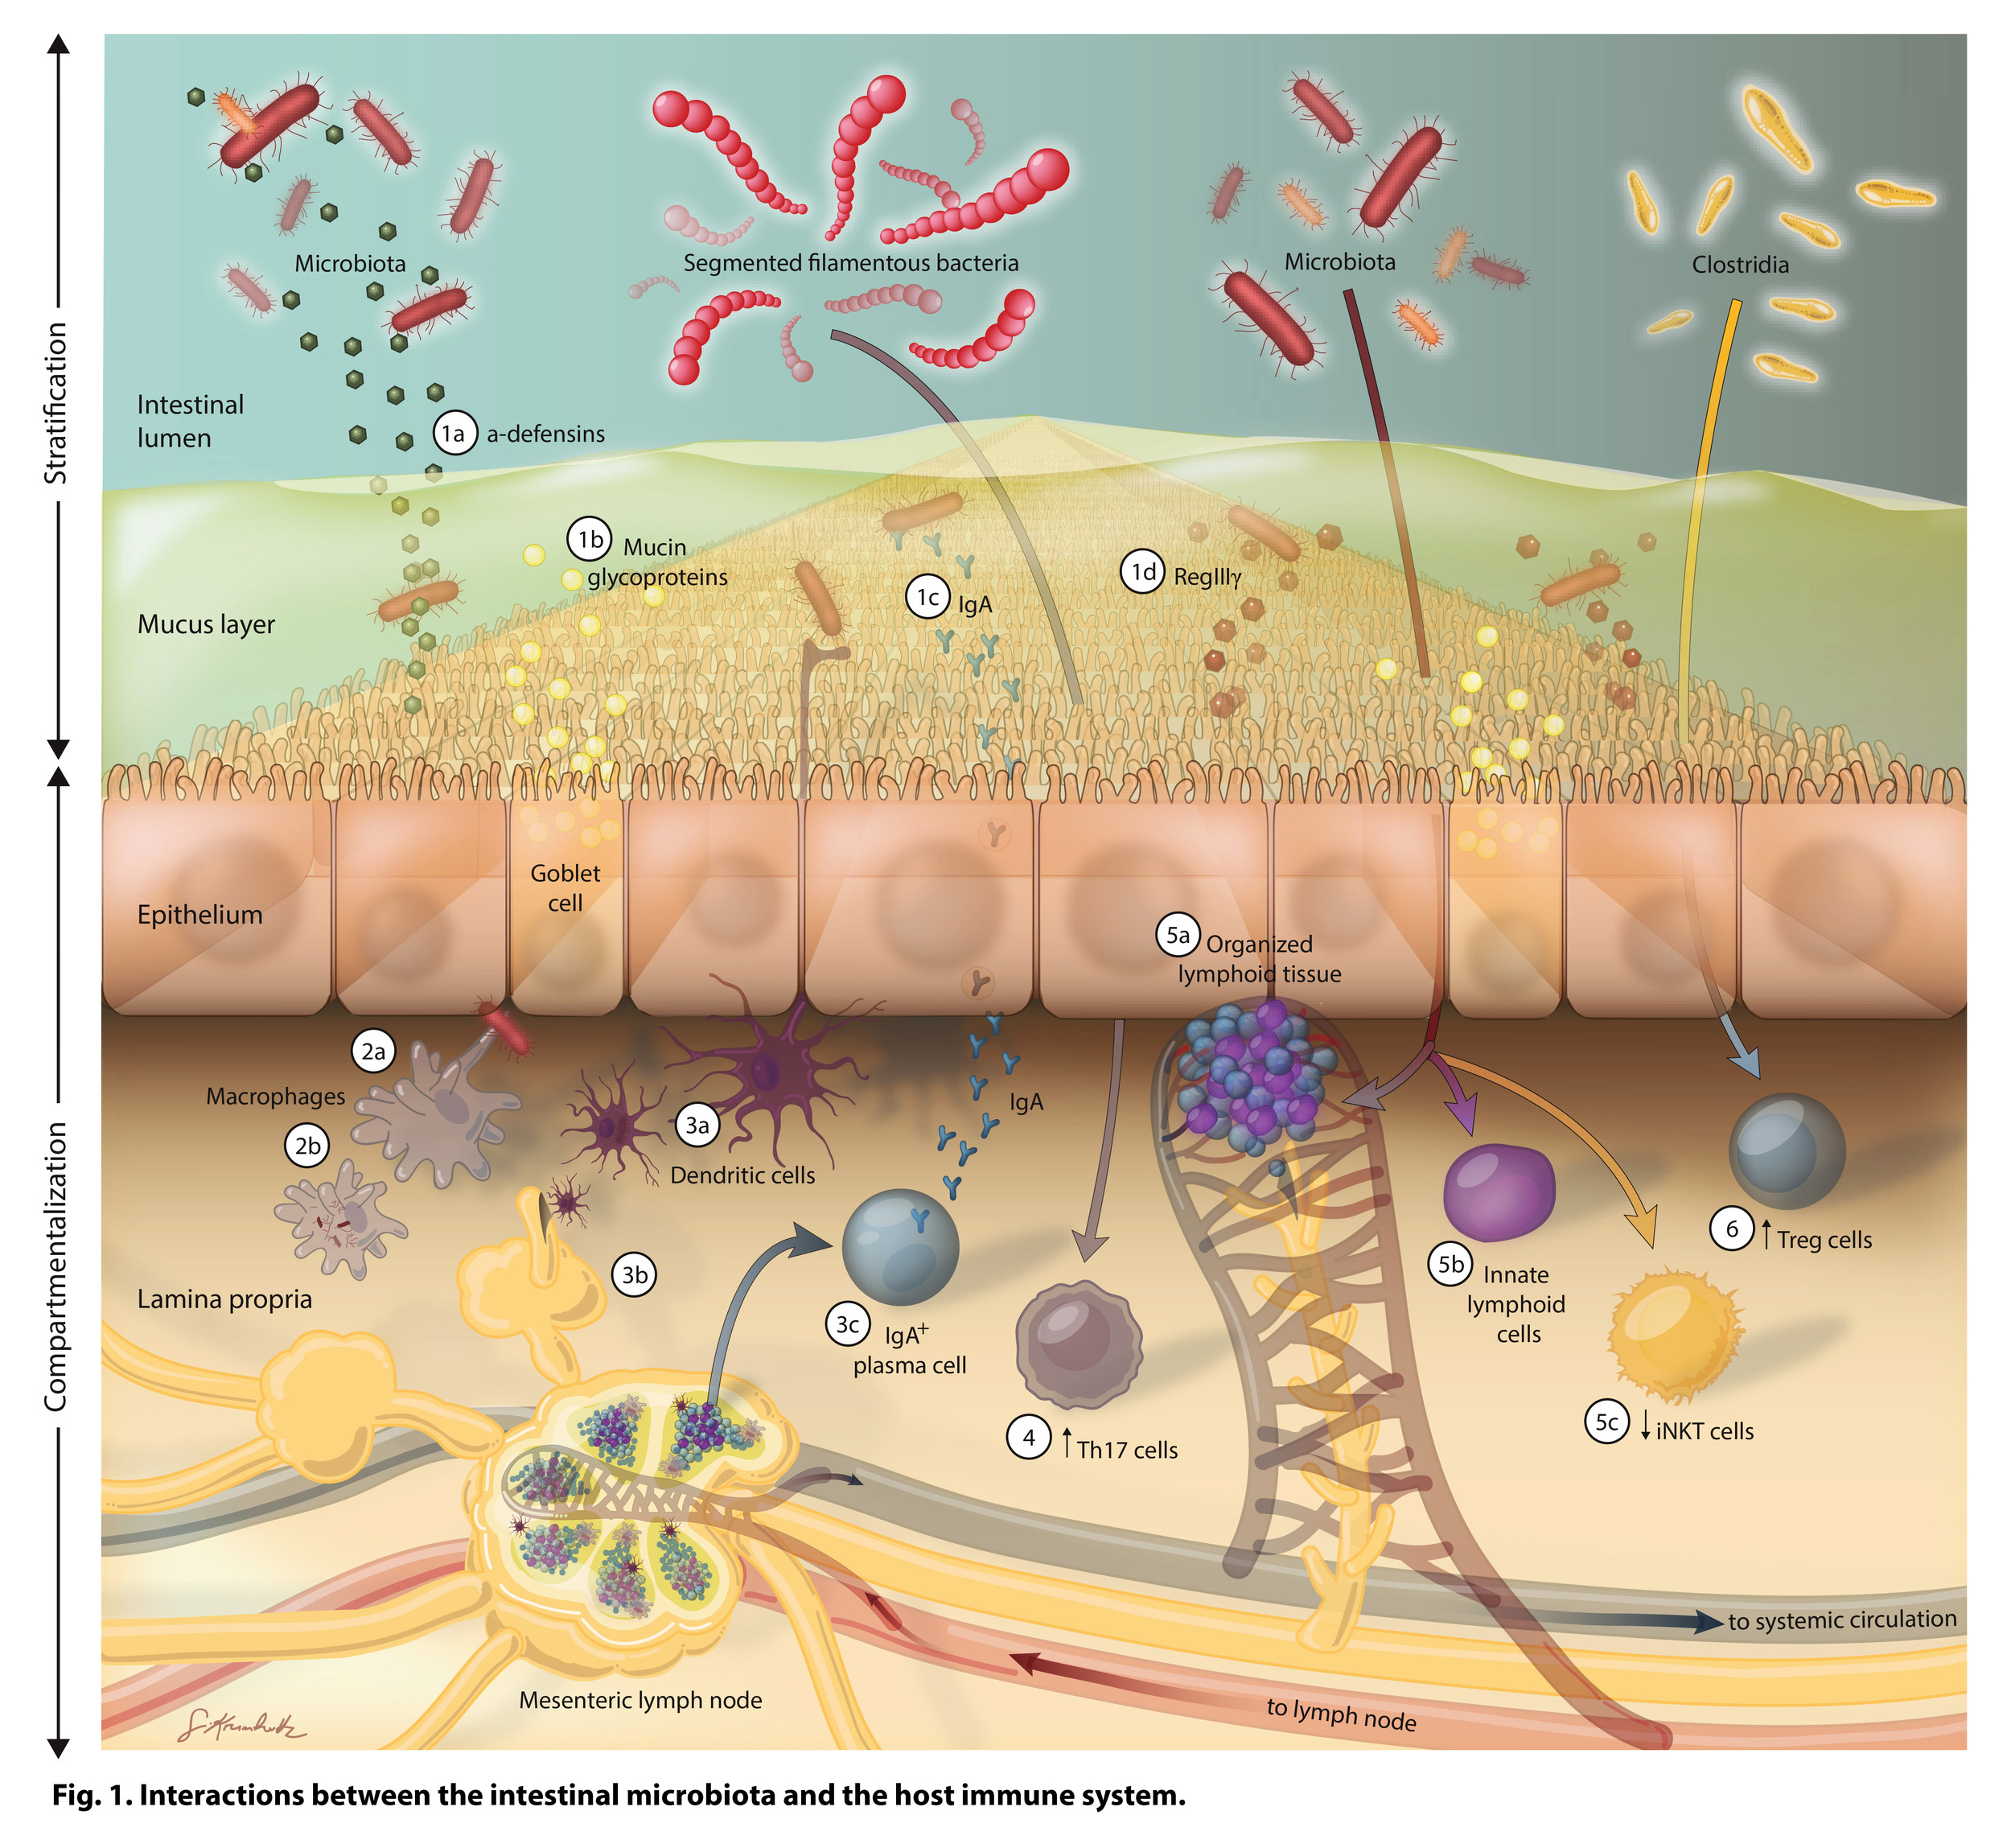
5
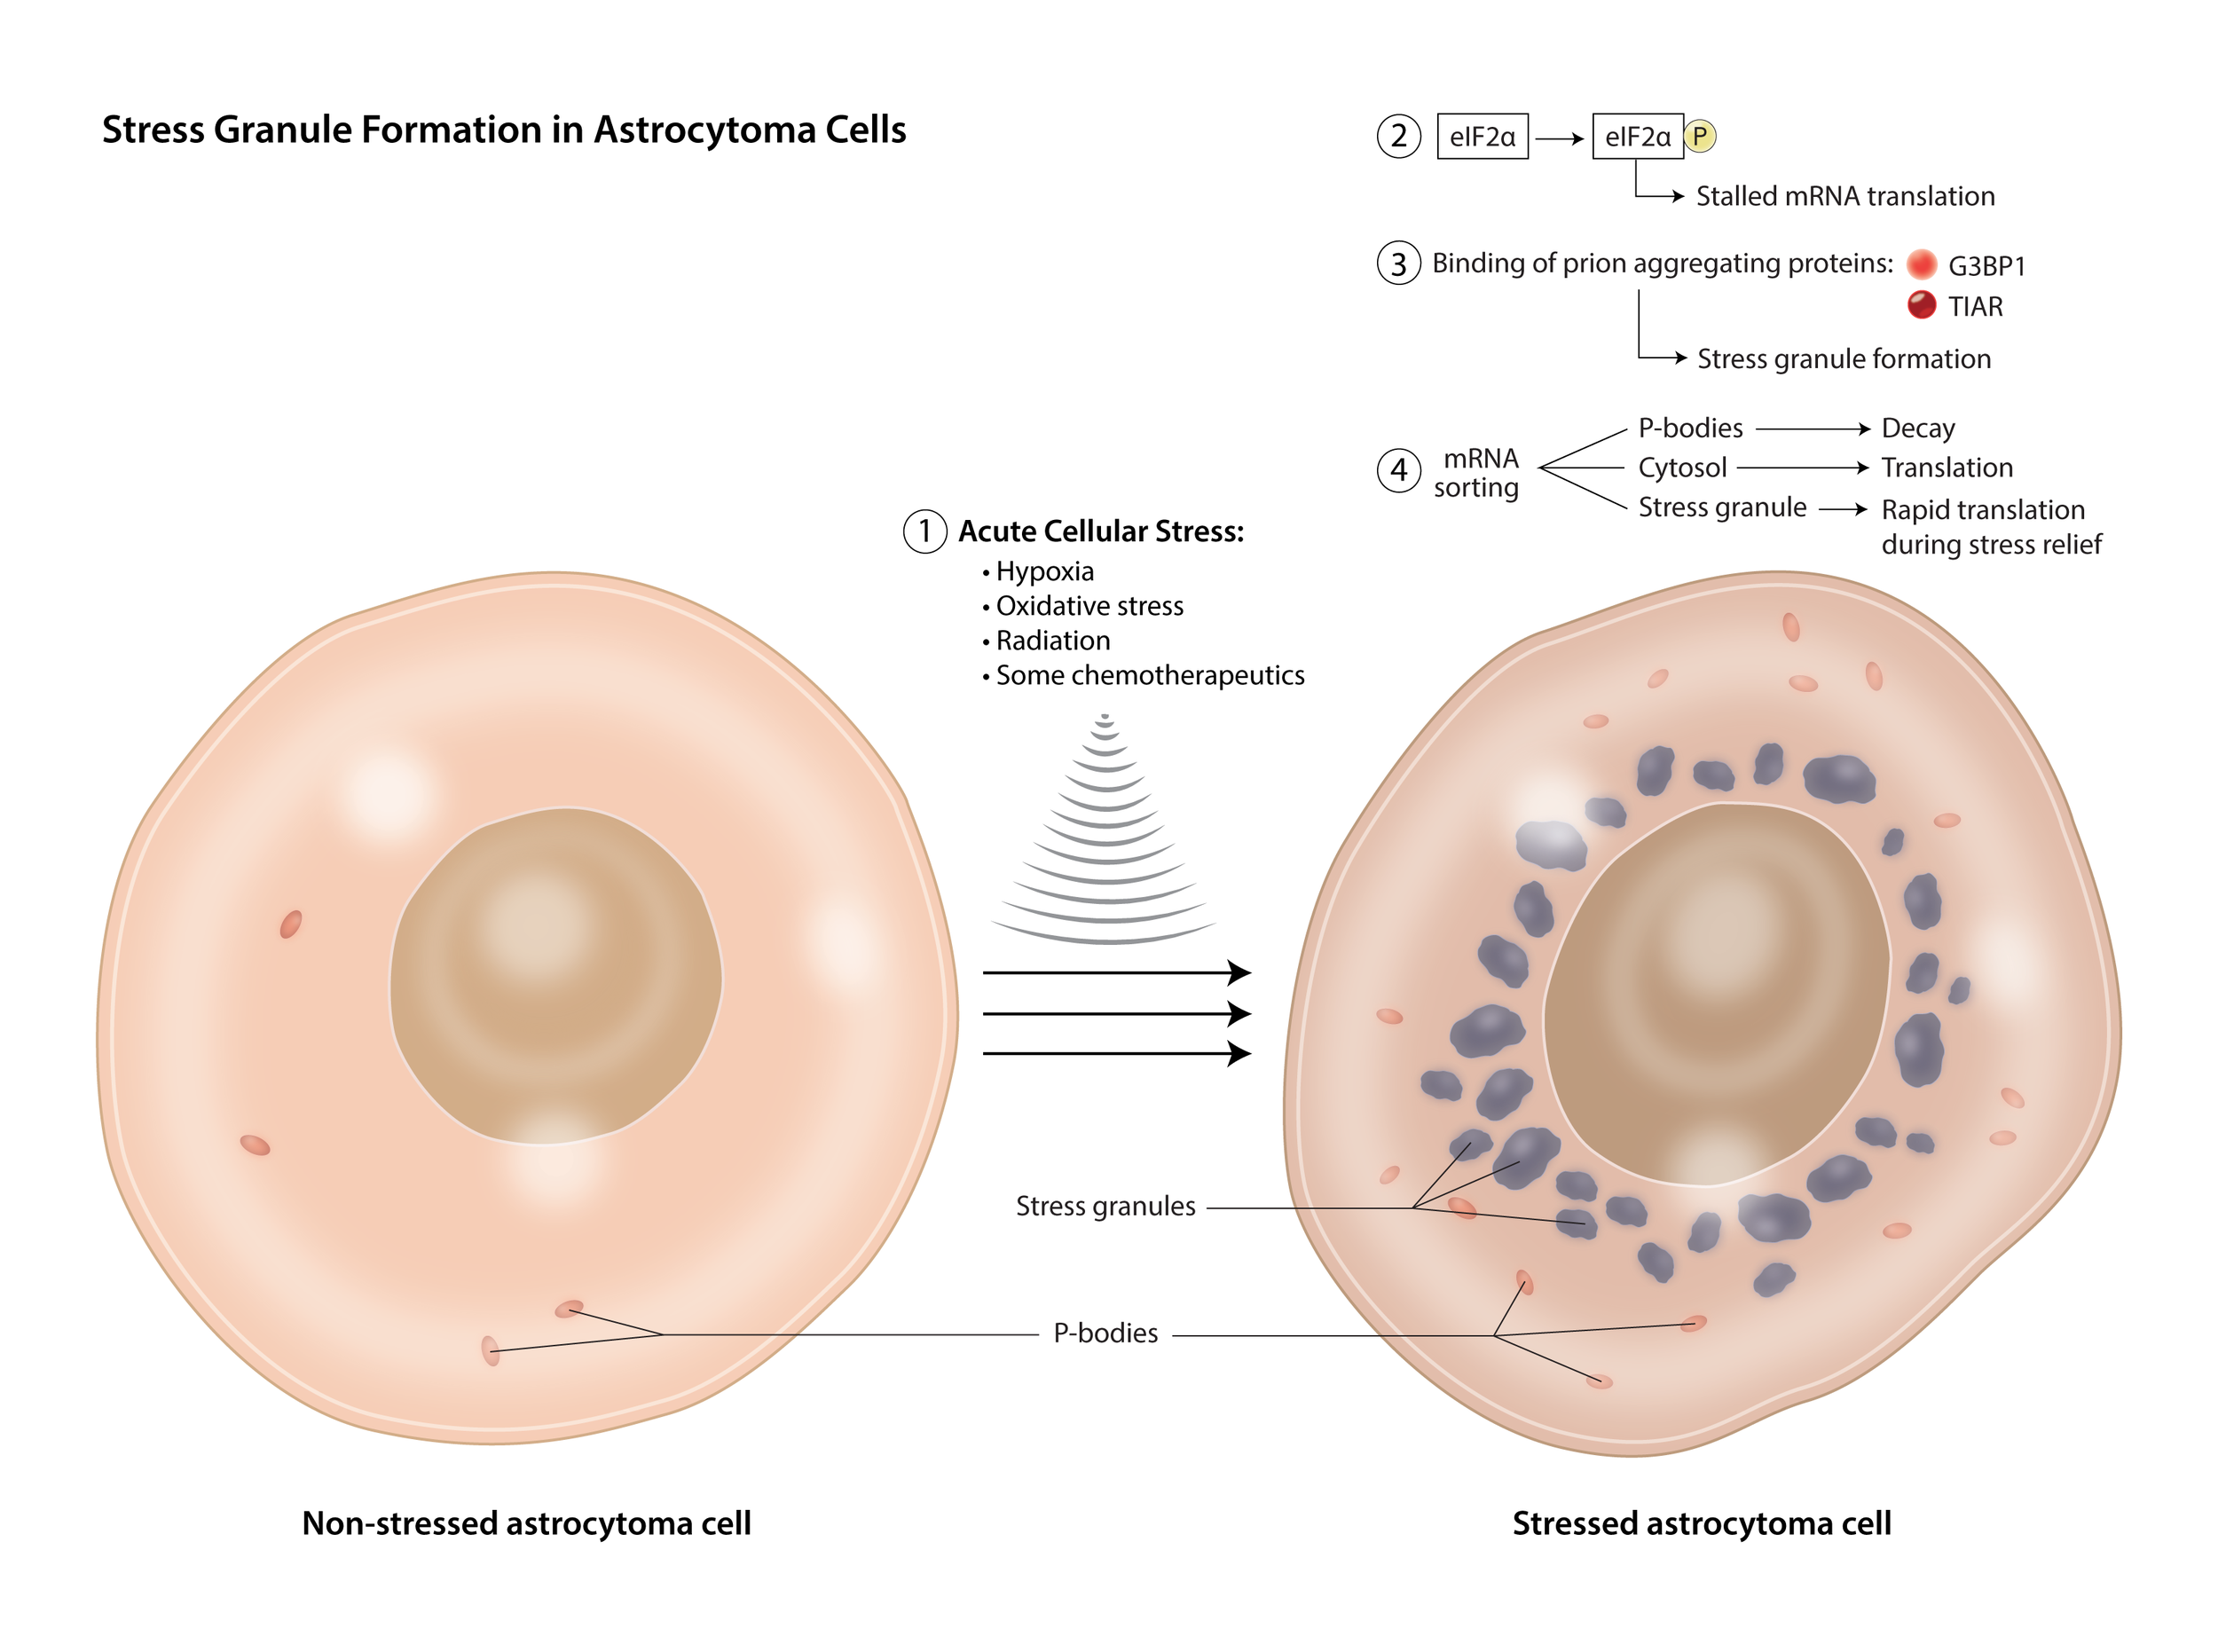
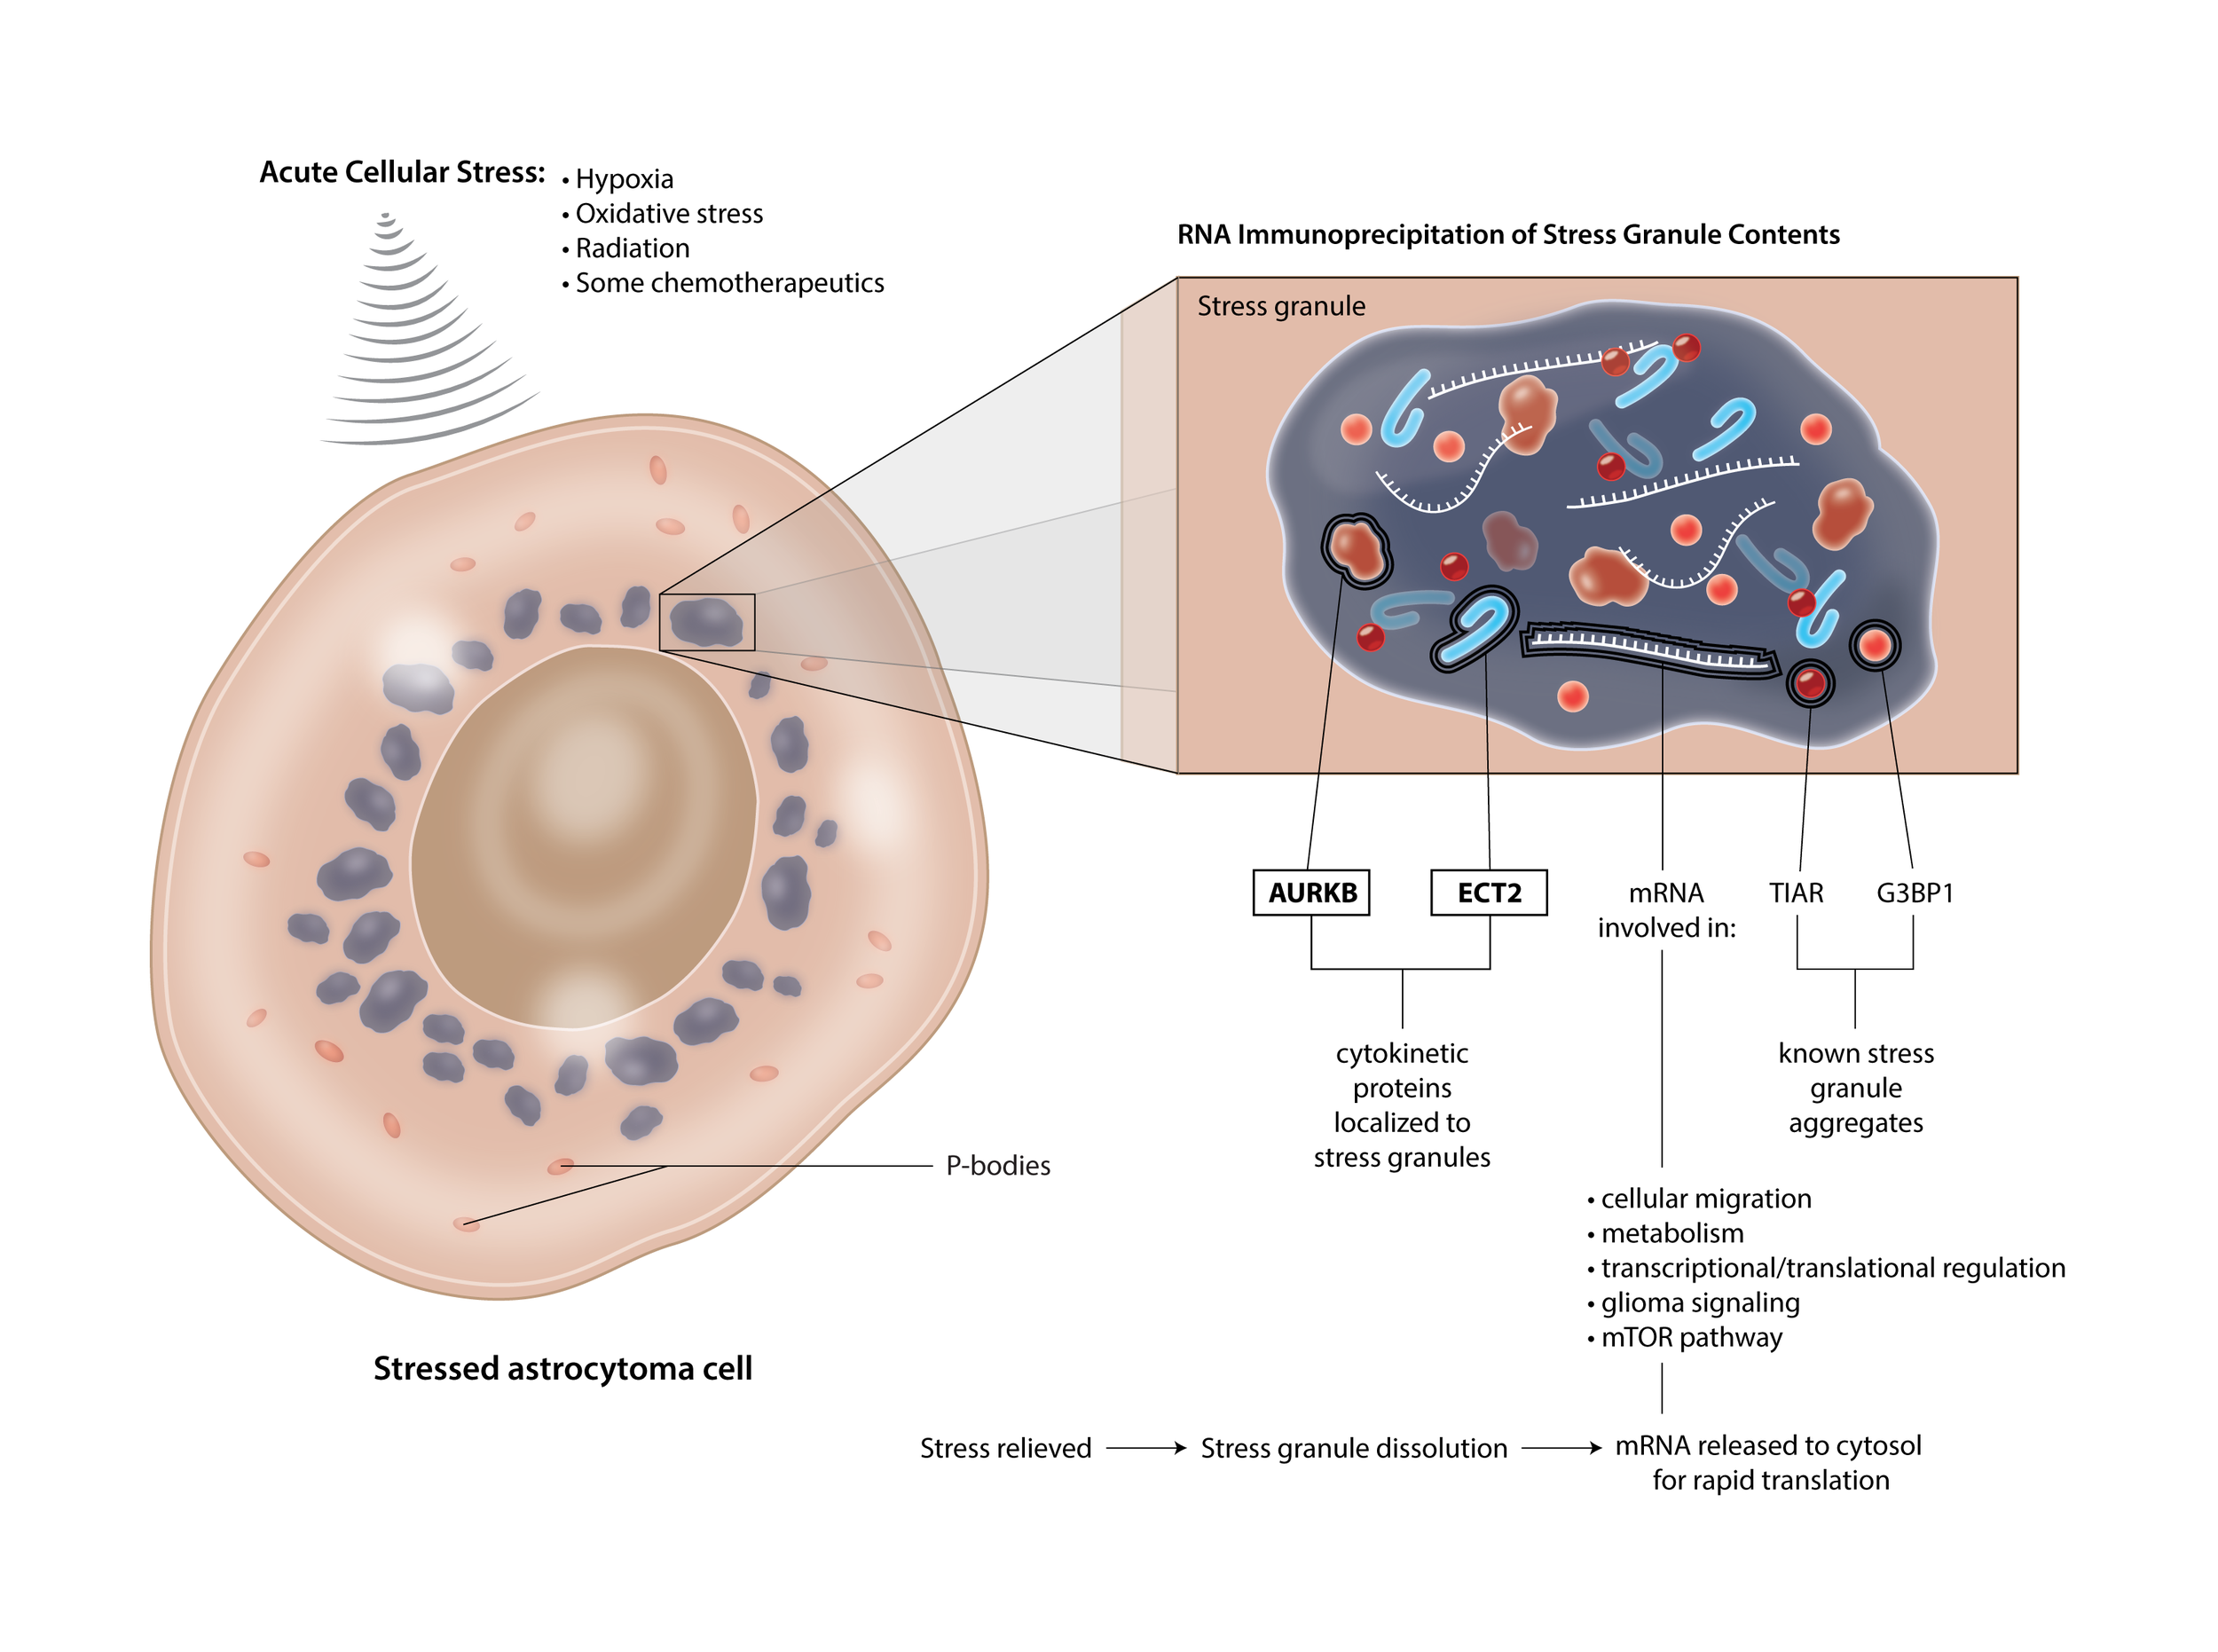
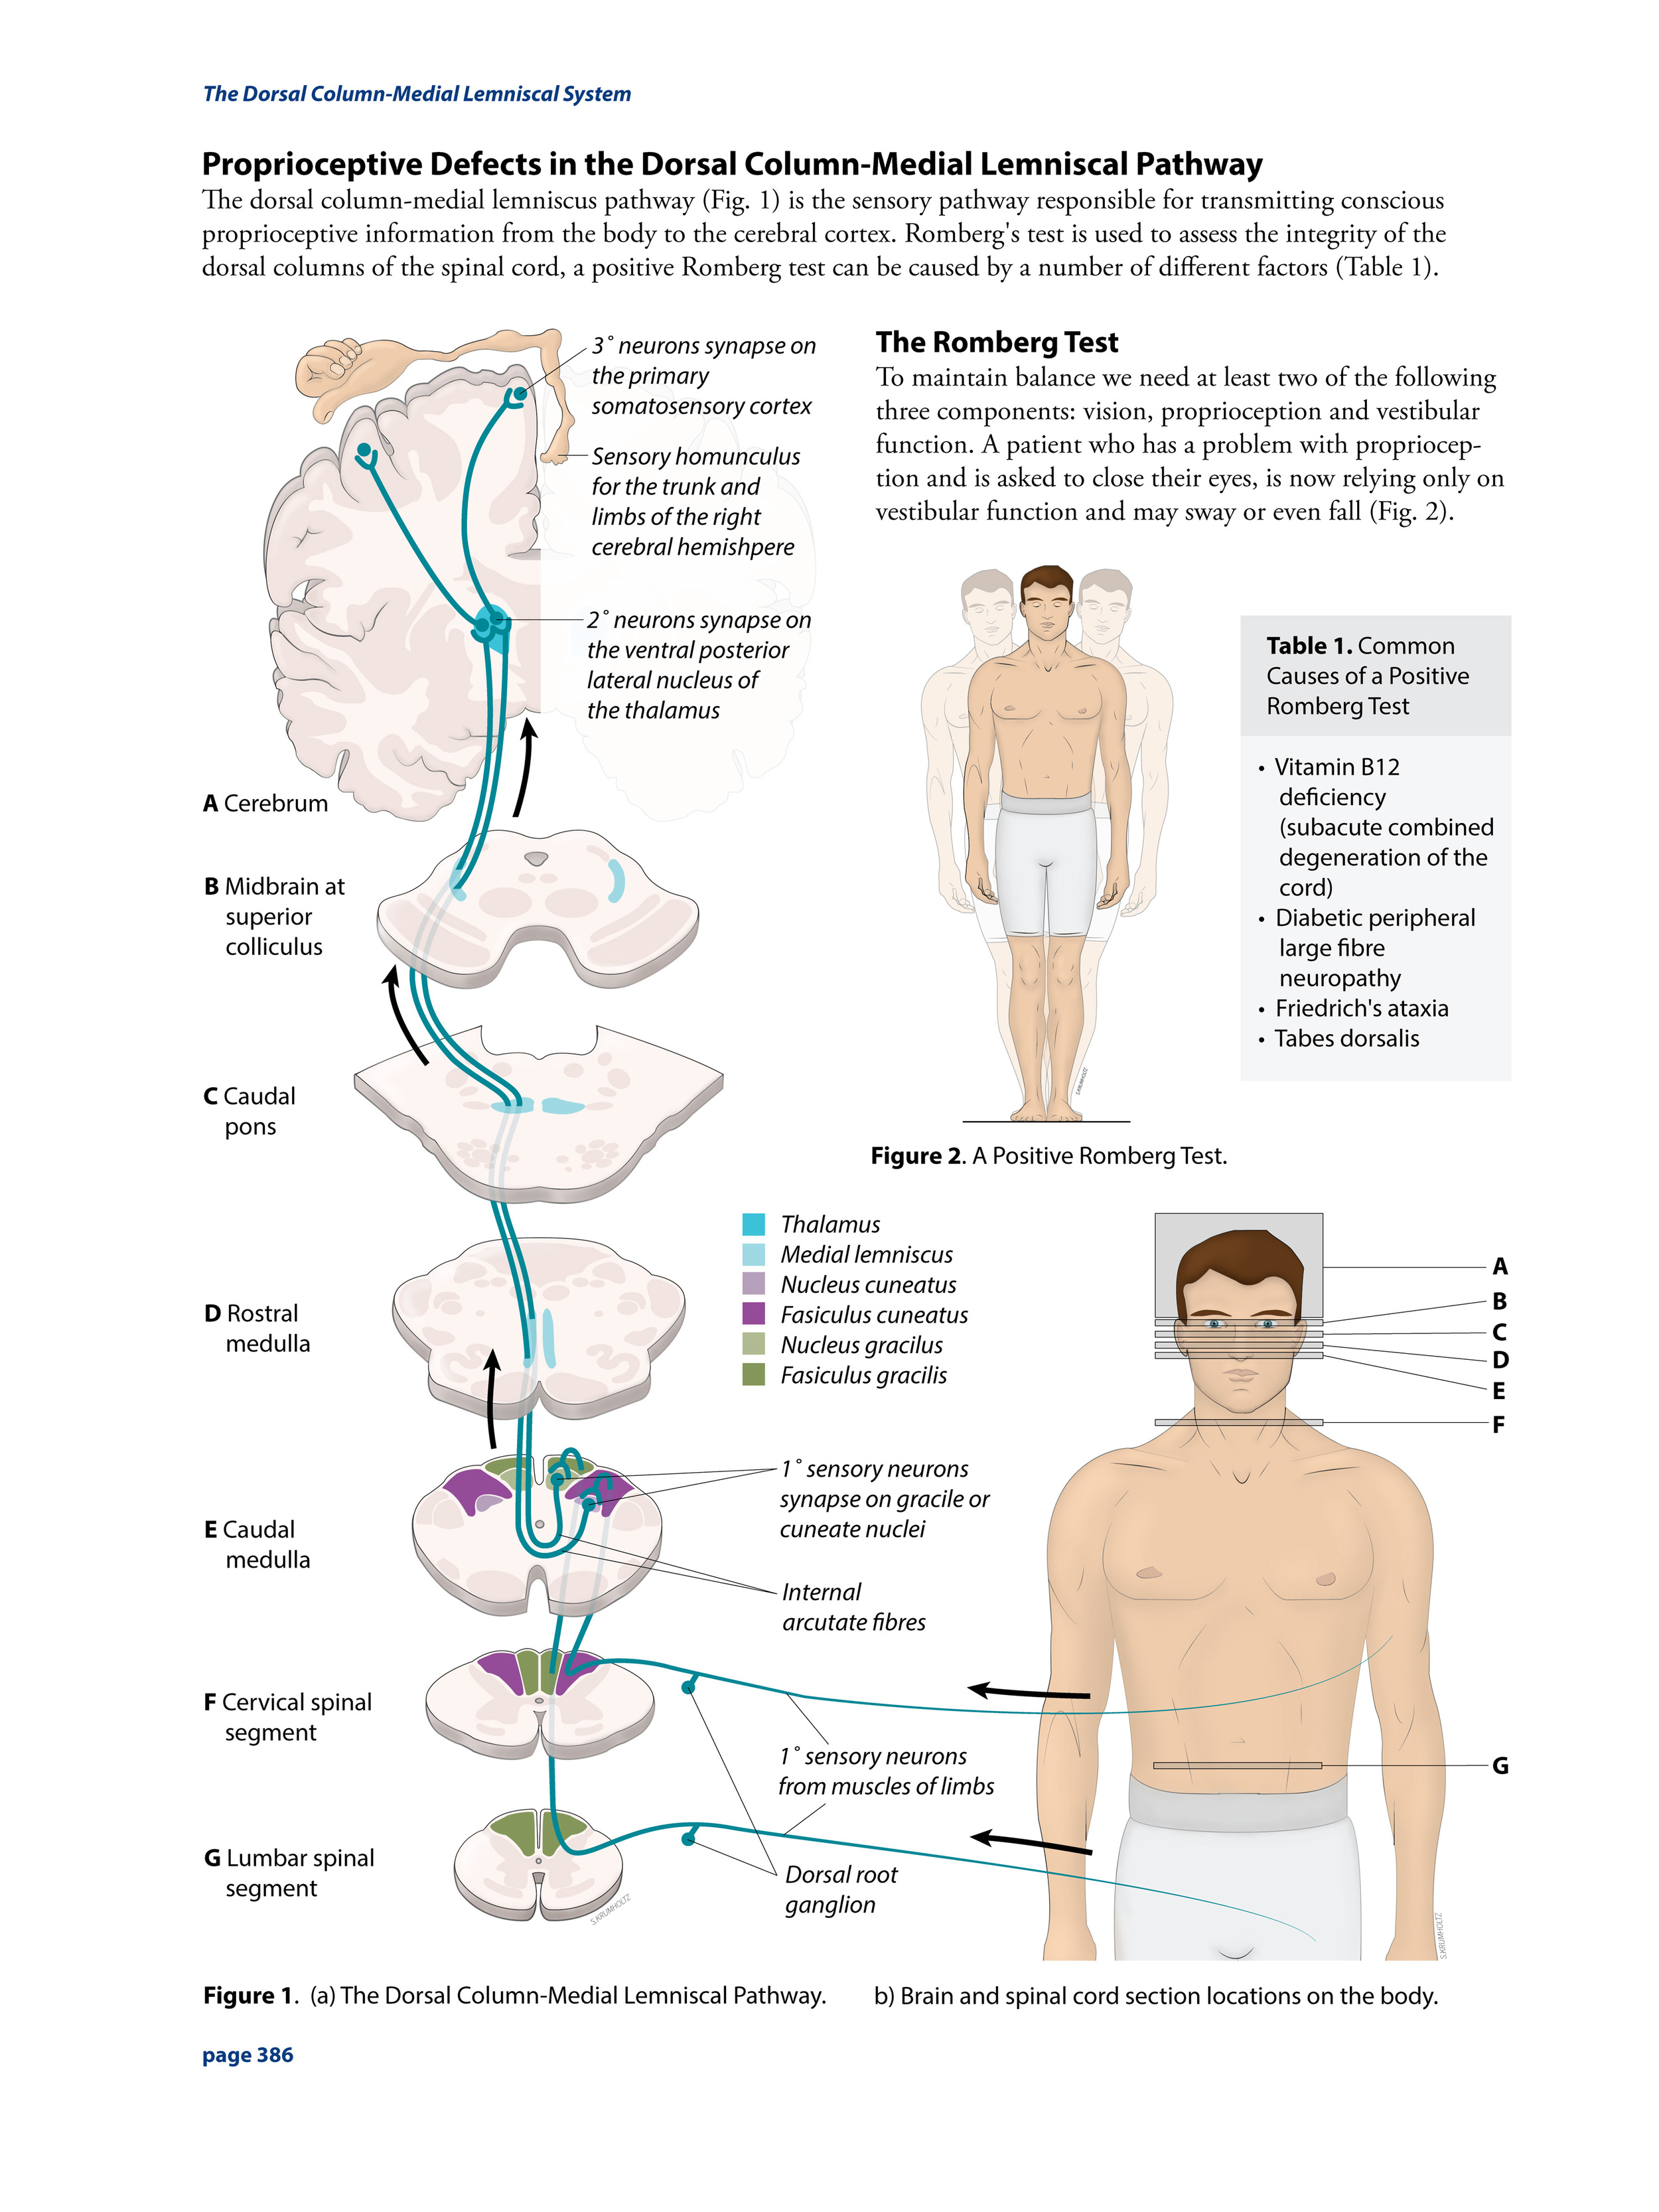
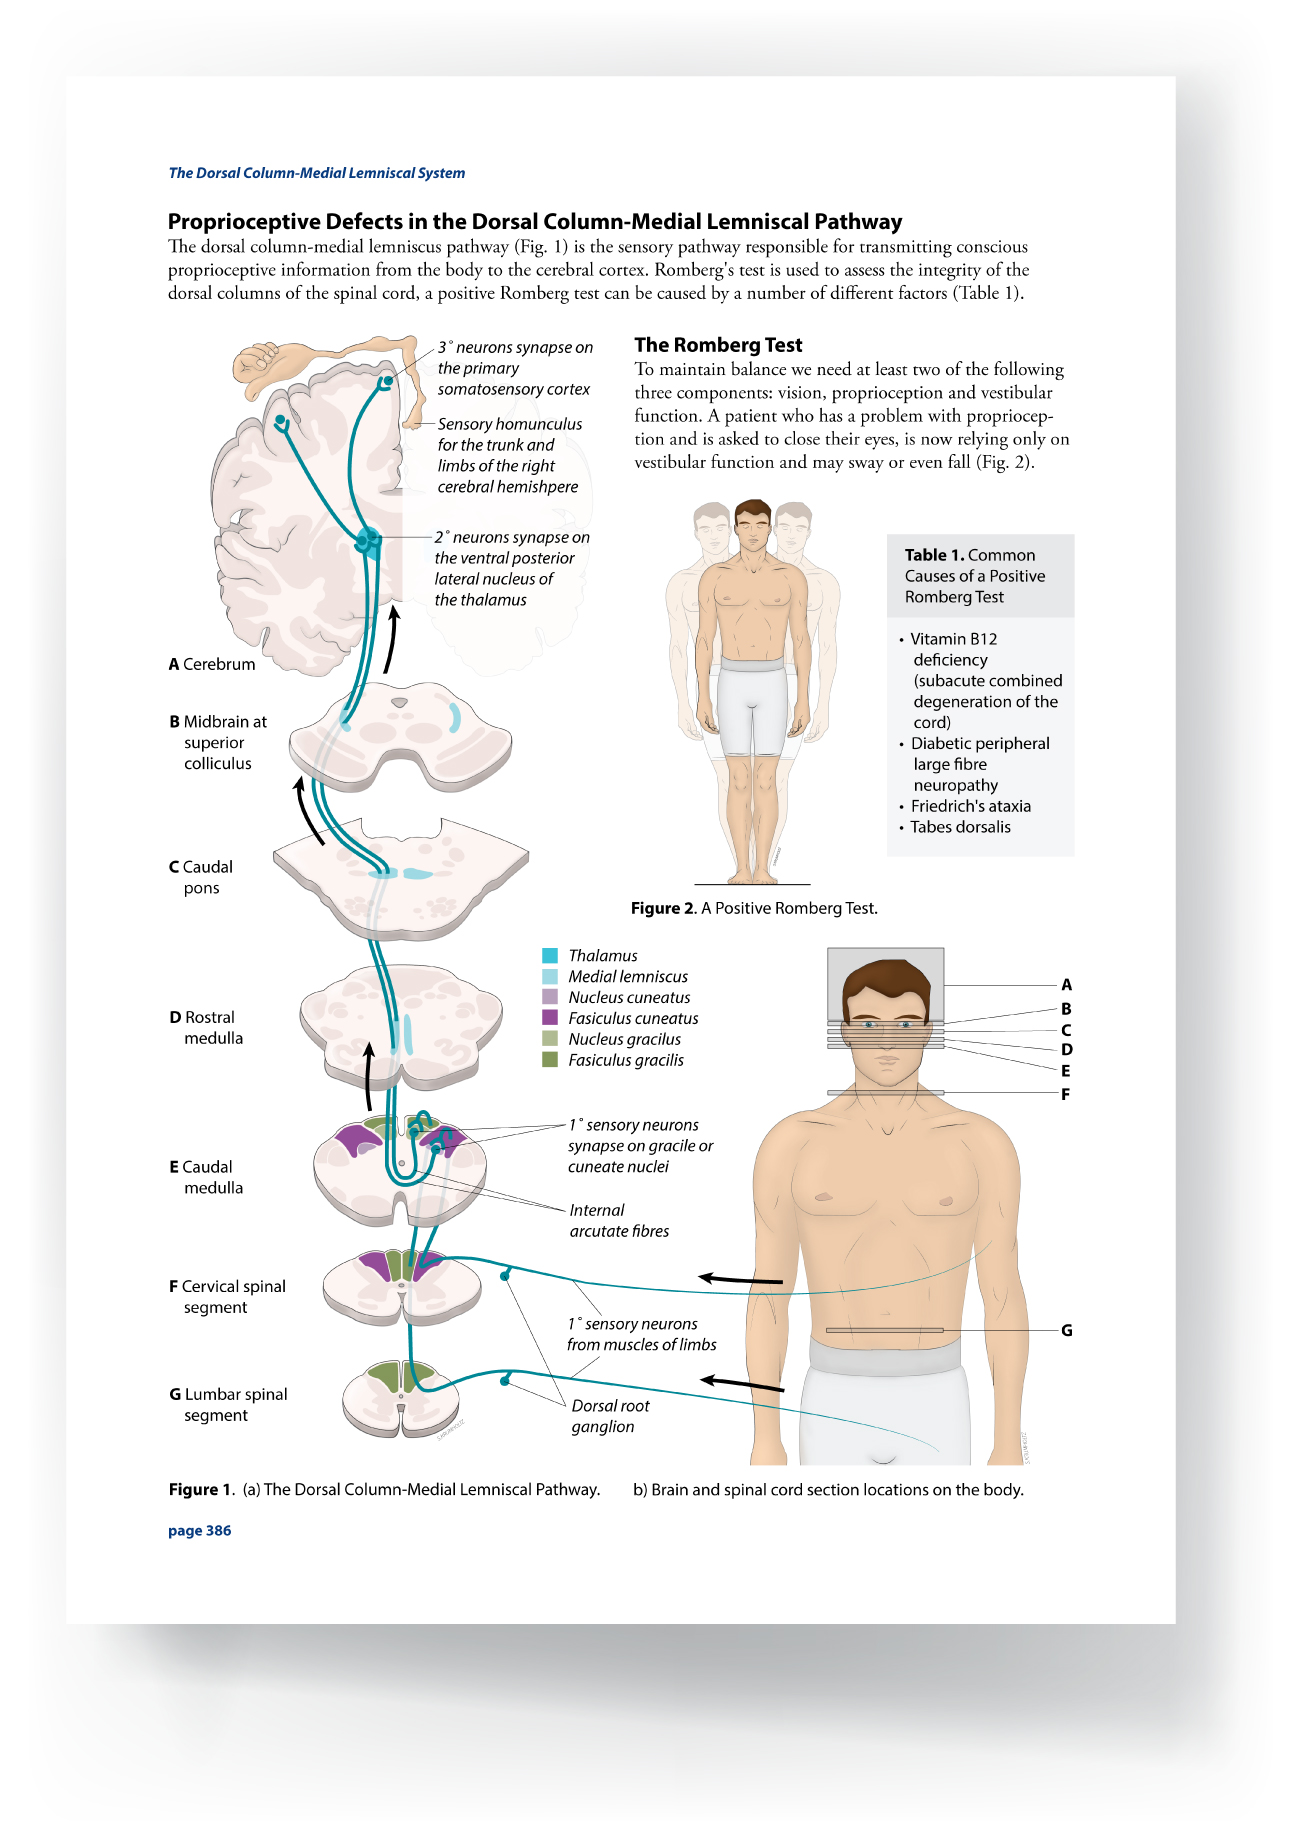
Pathway Schematics
1
The Romberg Test
1
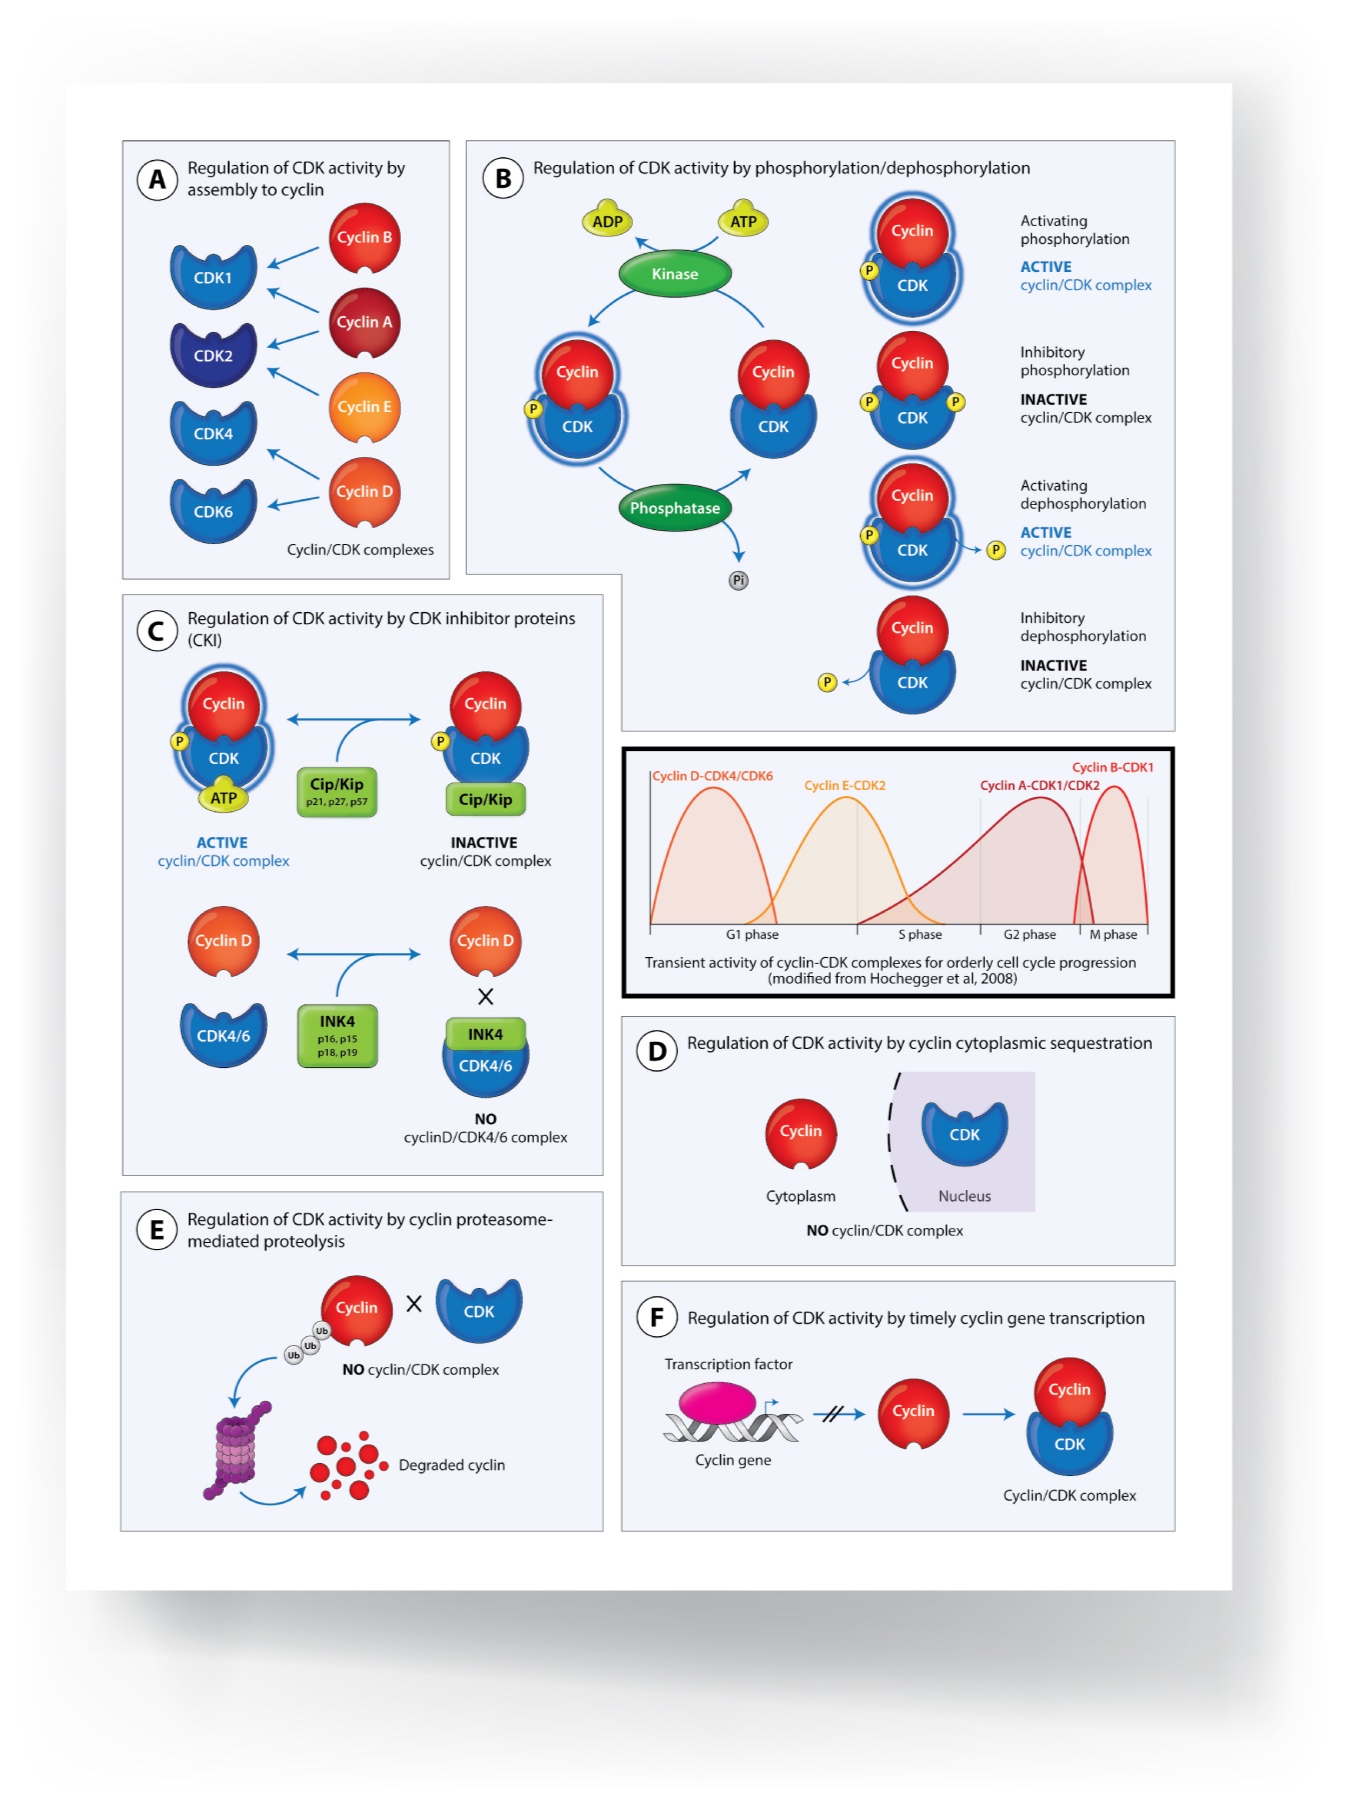
Regulation of CDK
4
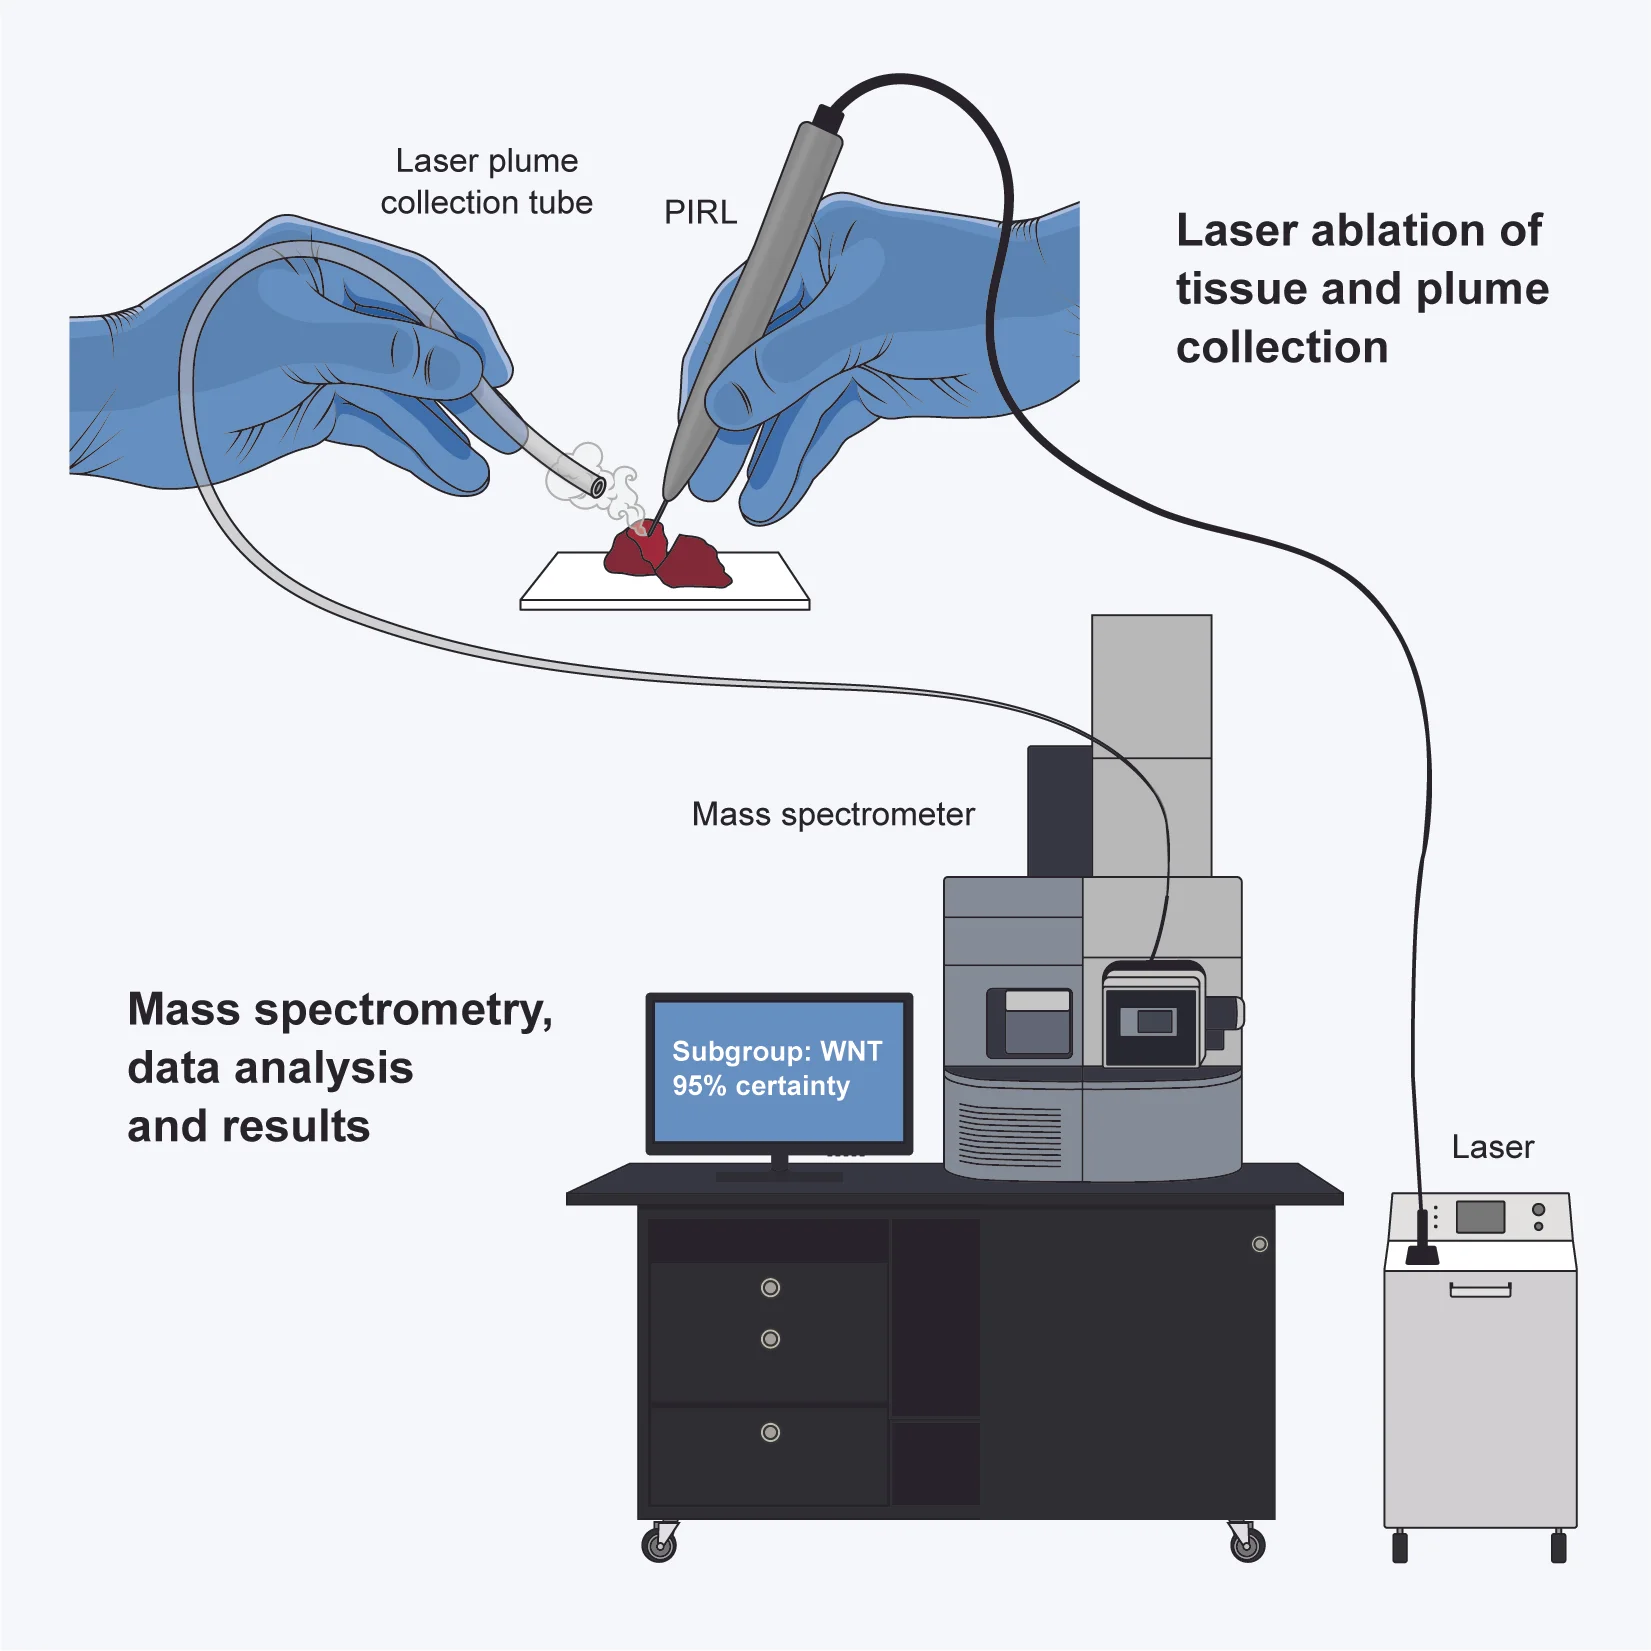
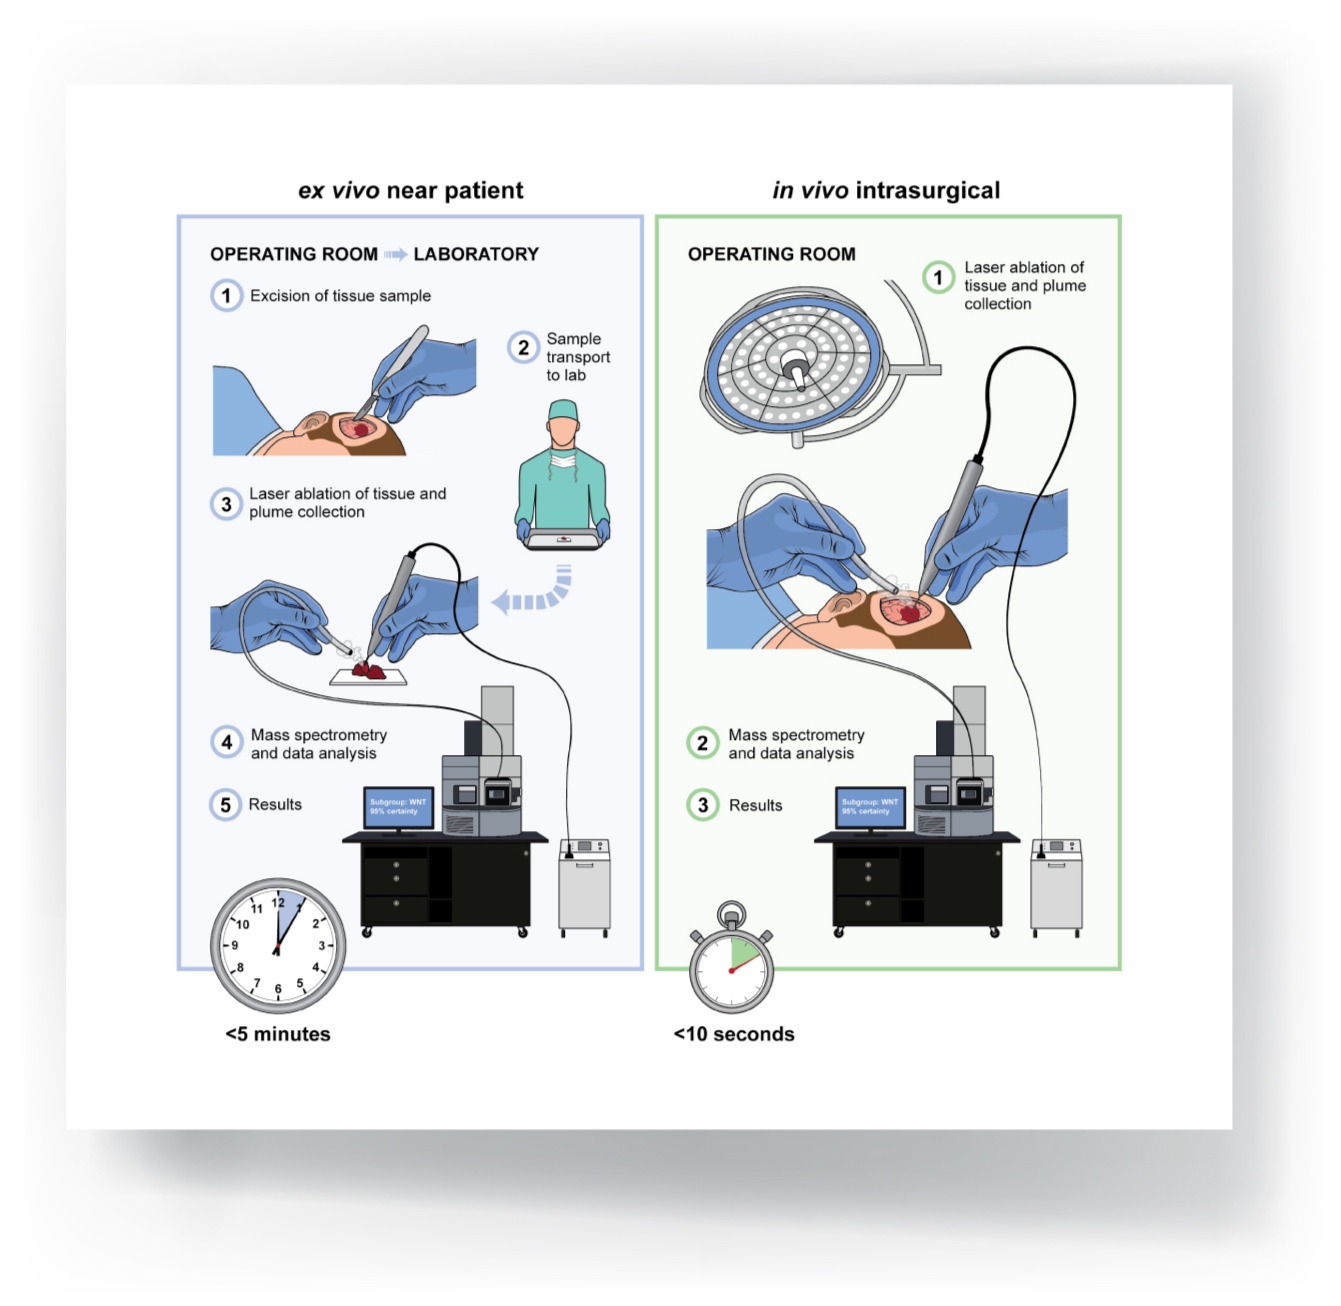
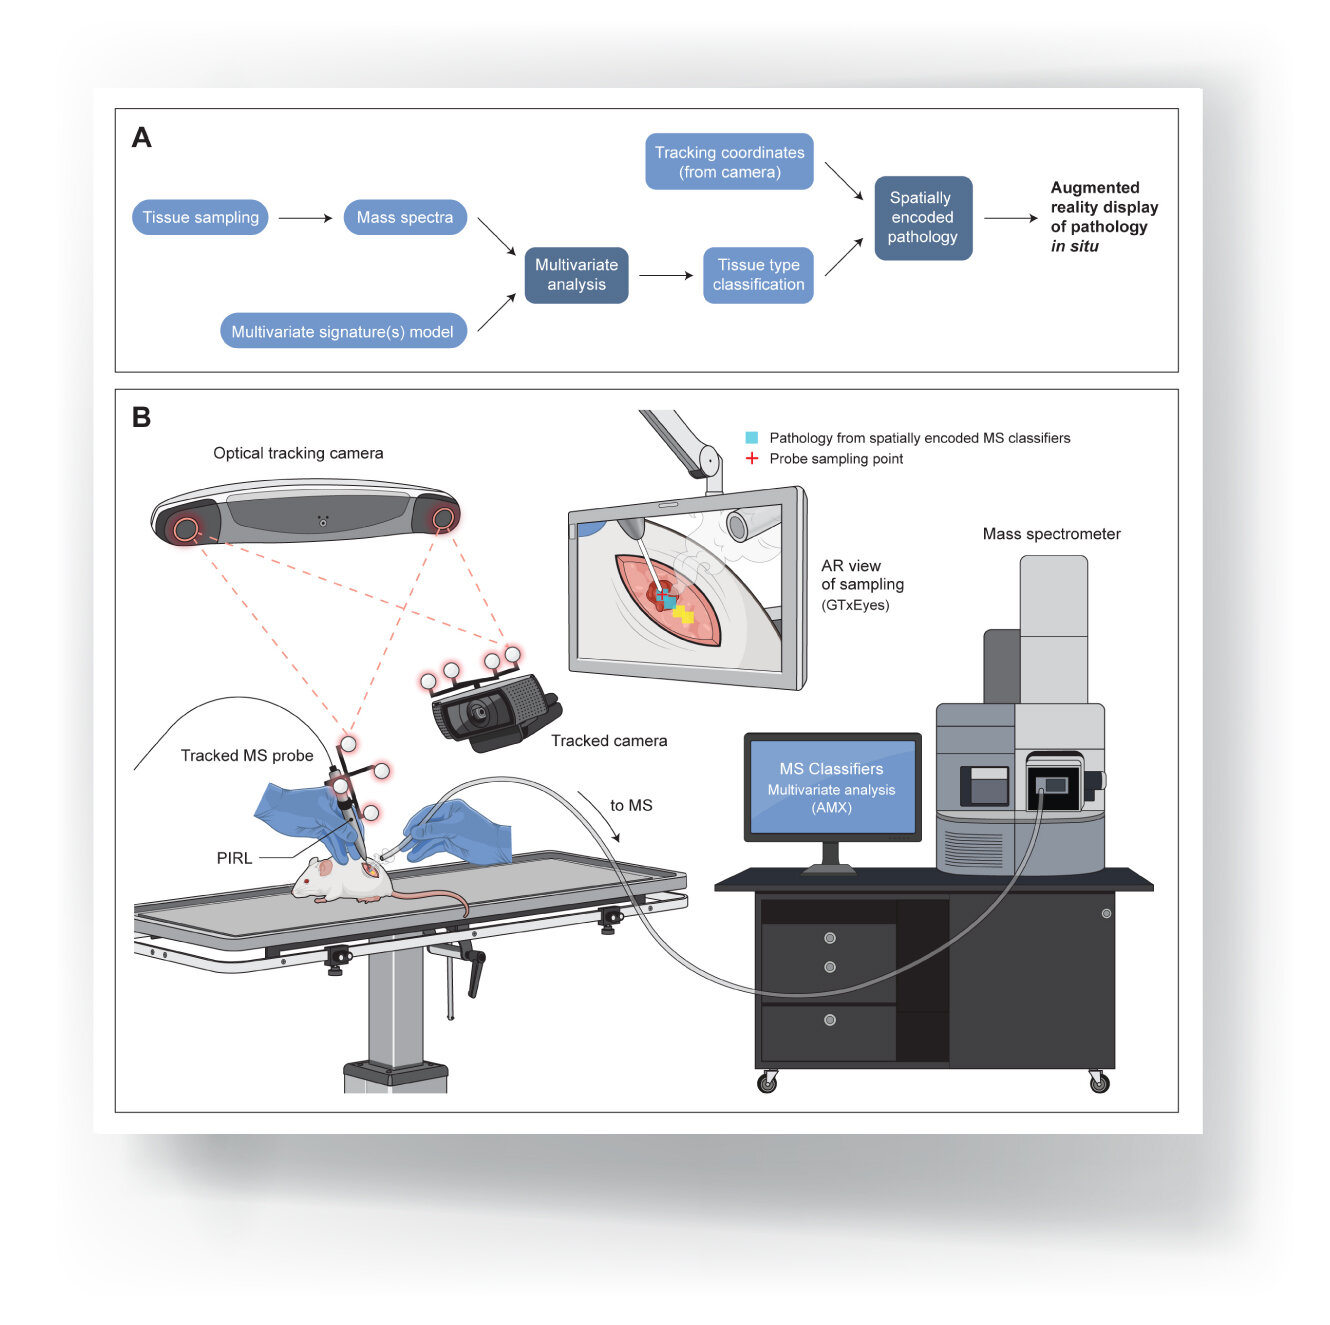
Infrared Laser Desorption Mass Spectrometry
1
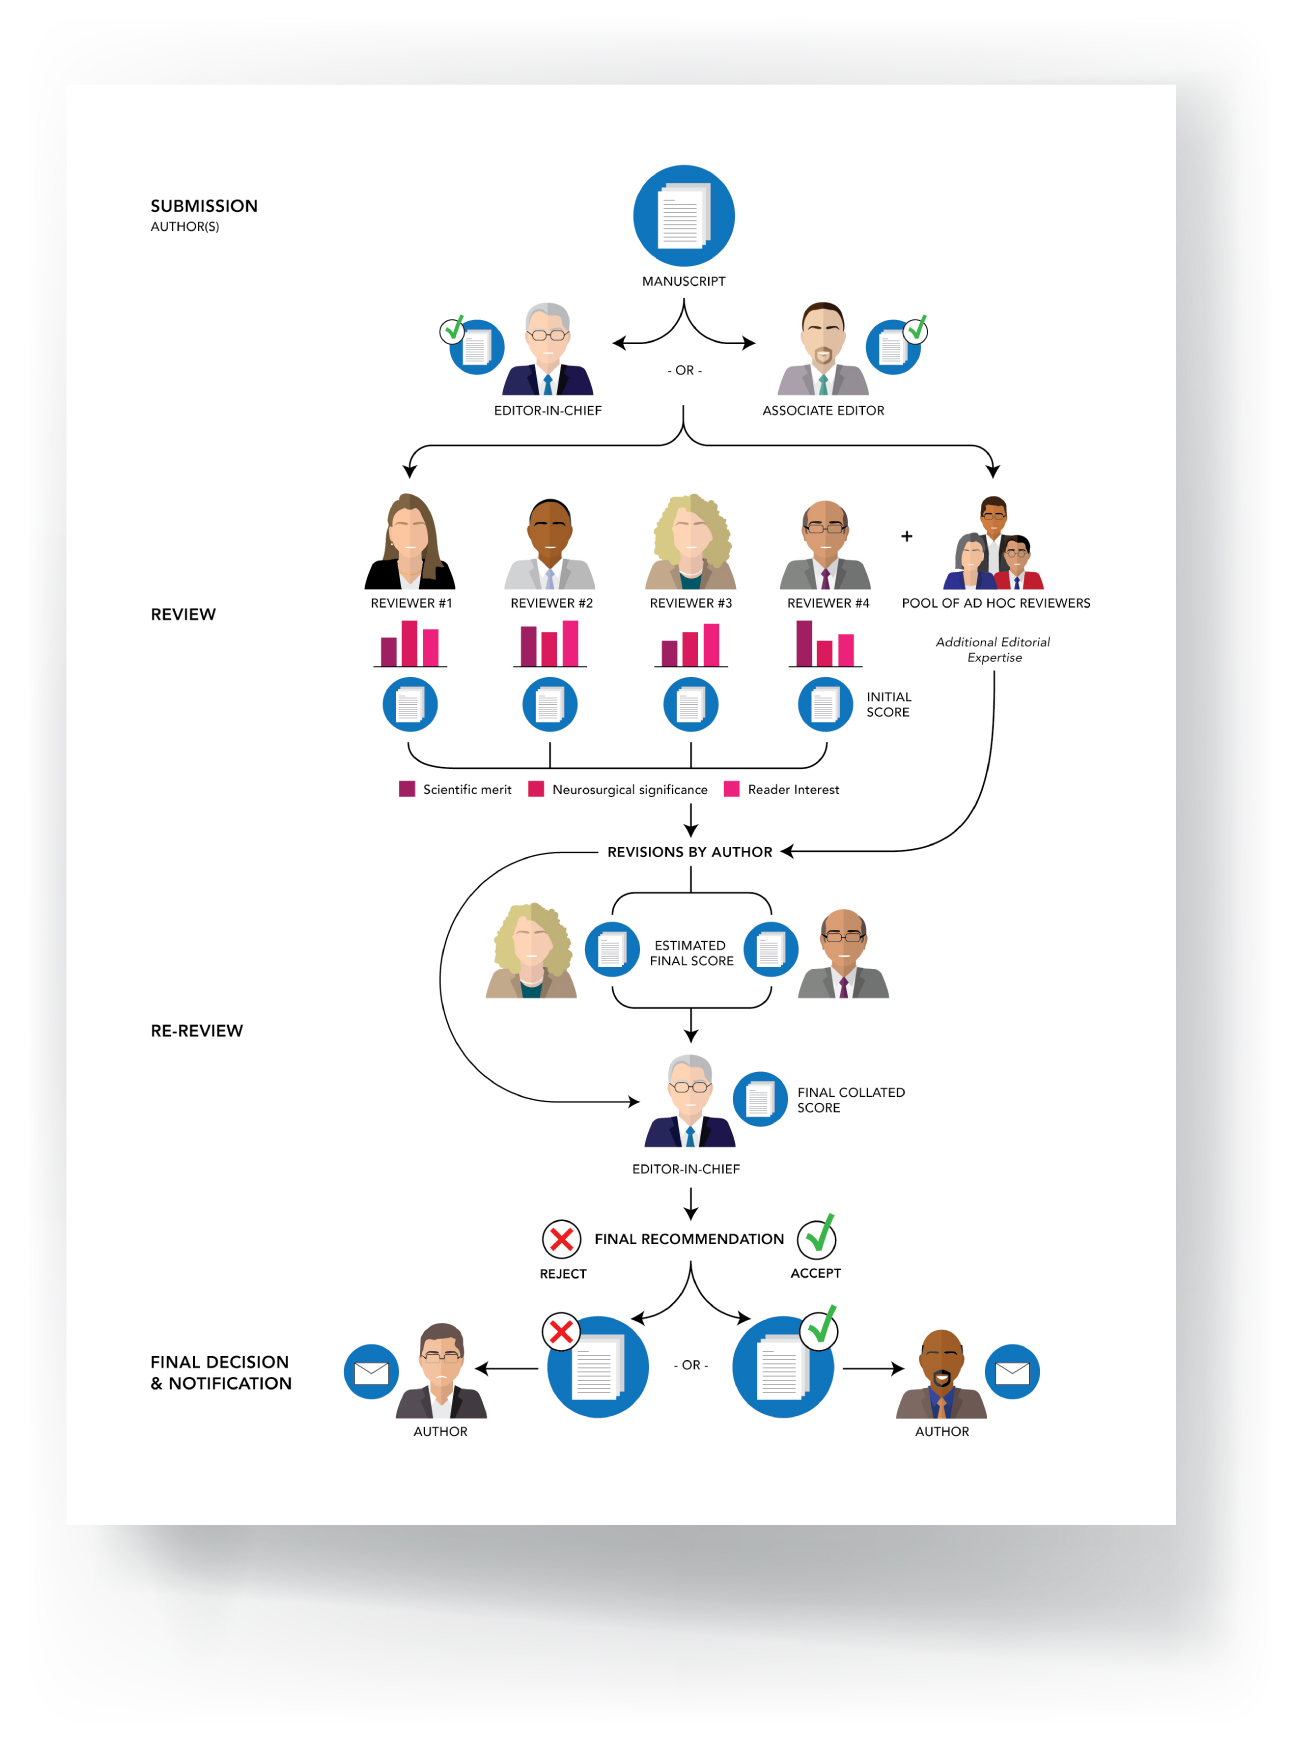
Submissions to the JNS

2
FUS + Gold Nanoparticles
2
Embryo Development
1
Mass Spec + AR